Immigrants from Serbia vs Immigrants from Colombia Professional Degree
COMPARE
Immigrants from Serbia
Immigrants from Colombia
Professional Degree
Professional Degree Comparison
Immigrants from Serbia
Immigrants from Colombia
5.8%
PROFESSIONAL DEGREE
100.0/ 100
METRIC RATING
52nd/ 347
METRIC RANK
4.5%
PROFESSIONAL DEGREE
59.4/ 100
METRIC RATING
166th/ 347
METRIC RANK
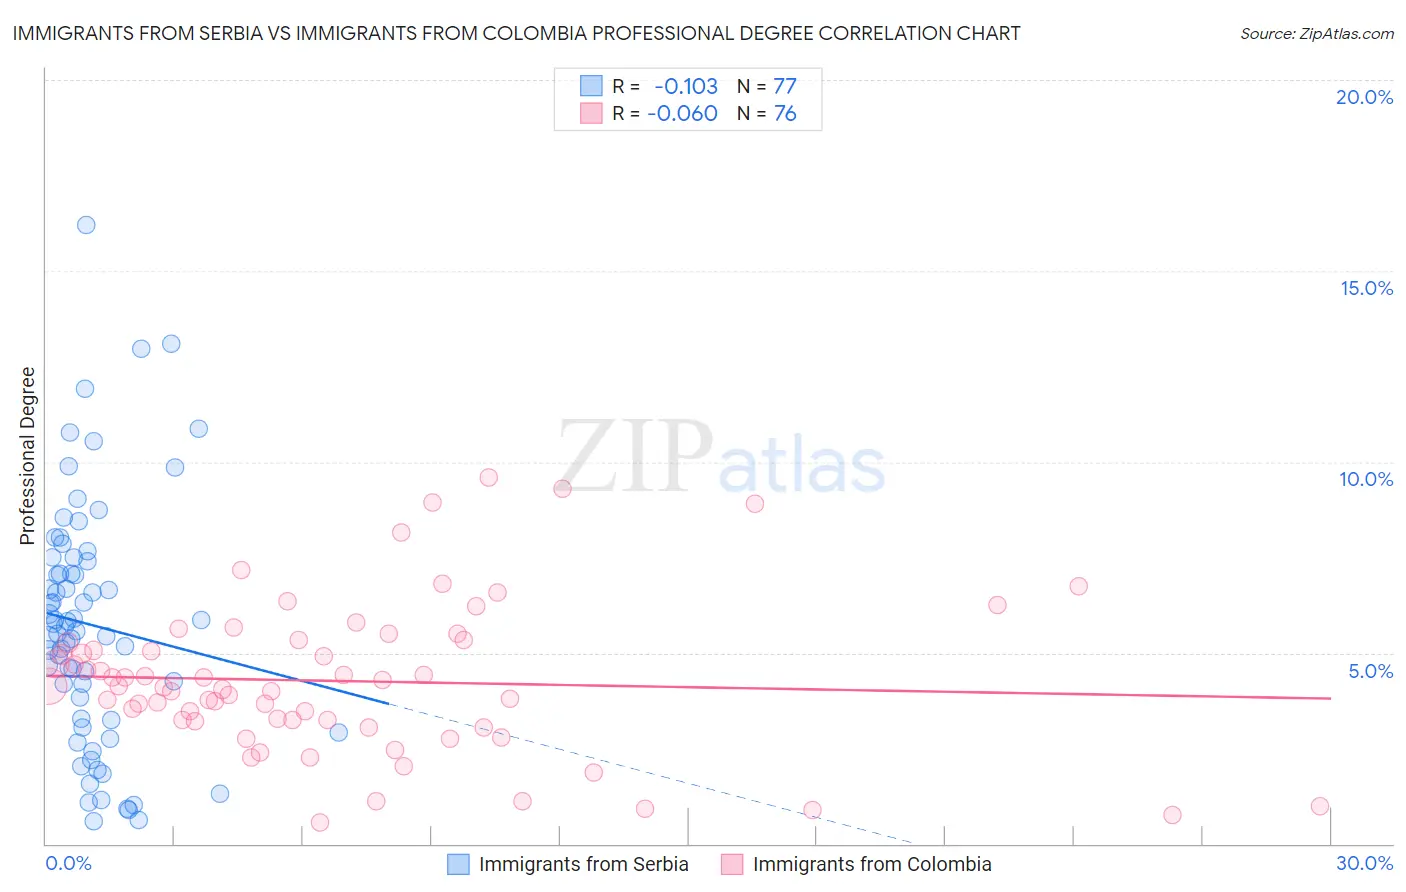
Immigrants from Serbia vs Immigrants from Colombia Professional Degree Correlation Chart
The statistical analysis conducted on geographies consisting of 131,711,422 people shows a poor negative correlation between the proportion of Immigrants from Serbia and percentage of population with at least professional degree education in the United States with a correlation coefficient (R) of -0.103 and weighted average of 5.8%. Similarly, the statistical analysis conducted on geographies consisting of 378,013,627 people shows a slight negative correlation between the proportion of Immigrants from Colombia and percentage of population with at least professional degree education in the United States with a correlation coefficient (R) of -0.060 and weighted average of 4.5%, a difference of 30.1%.
Professional Degree Correlation Summary
| Measurement | Immigrants from Serbia | Immigrants from Colombia |
| Minimum | 0.58% | 0.57% |
| Maximum | 16.2% | 9.6% |
| Range | 15.6% | 9.0% |
| Mean | 5.7% | 4.3% |
| Median | 5.7% | 4.1% |
| Interquartile 25% (IQ1) | 3.3% | 3.2% |
| Interquartile 75% (IQ3) | 7.5% | 5.3% |
| Interquartile Range (IQR) | 4.2% | 2.1% |
| Standard Deviation (Sample) | 3.2% | 2.0% |
| Standard Deviation (Population) | 3.2% | 2.0% |
Similar Demographics by Professional Degree
Demographics Similar to Immigrants from Serbia by Professional Degree
In terms of professional degree, the demographic groups most similar to Immigrants from Serbia are Immigrants from Greece (5.8%, a difference of 0.070%), Immigrants from Czechoslovakia (5.8%, a difference of 0.13%), Immigrants from Netherlands (5.8%, a difference of 0.23%), Immigrants from Latvia (5.8%, a difference of 0.45%), and Paraguayan (5.9%, a difference of 0.86%).
| Demographics | Rating | Rank | Professional Degree |
| Immigrants | South Central Asia | 100.0 /100 | #45 | Exceptional 5.9% |
| Immigrants | Argentina | 100.0 /100 | #46 | Exceptional 5.9% |
| Australians | 100.0 /100 | #47 | Exceptional 5.9% |
| Paraguayans | 100.0 /100 | #48 | Exceptional 5.9% |
| Immigrants | Latvia | 100.0 /100 | #49 | Exceptional 5.8% |
| Immigrants | Czechoslovakia | 100.0 /100 | #50 | Exceptional 5.8% |
| Immigrants | Greece | 100.0 /100 | #51 | Exceptional 5.8% |
| Immigrants | Serbia | 100.0 /100 | #52 | Exceptional 5.8% |
| Immigrants | Netherlands | 100.0 /100 | #53 | Exceptional 5.8% |
| Immigrants | Kuwait | 100.0 /100 | #54 | Exceptional 5.7% |
| Immigrants | Western Europe | 100.0 /100 | #55 | Exceptional 5.7% |
| Immigrants | Malaysia | 100.0 /100 | #56 | Exceptional 5.7% |
| South Africans | 100.0 /100 | #57 | Exceptional 5.7% |
| Bulgarians | 100.0 /100 | #58 | Exceptional 5.7% |
| Immigrants | Europe | 100.0 /100 | #59 | Exceptional 5.6% |
Demographics Similar to Immigrants from Colombia by Professional Degree
In terms of professional degree, the demographic groups most similar to Immigrants from Colombia are Immigrants from Afghanistan (4.5%, a difference of 0.030%), Costa Rican (4.5%, a difference of 0.080%), Immigrants from Sierra Leone (4.5%, a difference of 0.10%), Chinese (4.5%, a difference of 0.11%), and Swiss (4.5%, a difference of 0.24%).
| Demographics | Rating | Rank | Professional Degree |
| Vietnamese | 68.4 /100 | #159 | Good 4.5% |
| Immigrants | Senegal | 68.0 /100 | #160 | Good 4.5% |
| Assyrians/Chaldeans/Syriacs | 67.4 /100 | #161 | Good 4.5% |
| Peruvians | 65.2 /100 | #162 | Good 4.5% |
| Sierra Leoneans | 64.3 /100 | #163 | Good 4.5% |
| Swiss | 61.0 /100 | #164 | Good 4.5% |
| Costa Ricans | 59.9 /100 | #165 | Average 4.5% |
| Immigrants | Colombia | 59.4 /100 | #166 | Average 4.5% |
| Immigrants | Afghanistan | 59.2 /100 | #167 | Average 4.5% |
| Immigrants | Sierra Leone | 58.7 /100 | #168 | Average 4.5% |
| Chinese | 58.6 /100 | #169 | Average 4.5% |
| Immigrants | Zaire | 57.4 /100 | #170 | Average 4.5% |
| Immigrants | Bangladesh | 56.0 /100 | #171 | Average 4.4% |
| Spaniards | 52.0 /100 | #172 | Average 4.4% |
| English | 50.1 /100 | #173 | Average 4.4% |