Cree vs Immigrants from Sierra Leone Doctorate Degree
COMPARE
Cree
Immigrants from Sierra Leone
Doctorate Degree
Doctorate Degree Comparison
Cree
Immigrants from Sierra Leone
1.6%
DOCTORATE DEGREE
3.0/ 100
METRIC RATING
235th/ 347
METRIC RANK
2.0%
DOCTORATE DEGREE
90.2/ 100
METRIC RATING
131st/ 347
METRIC RANK
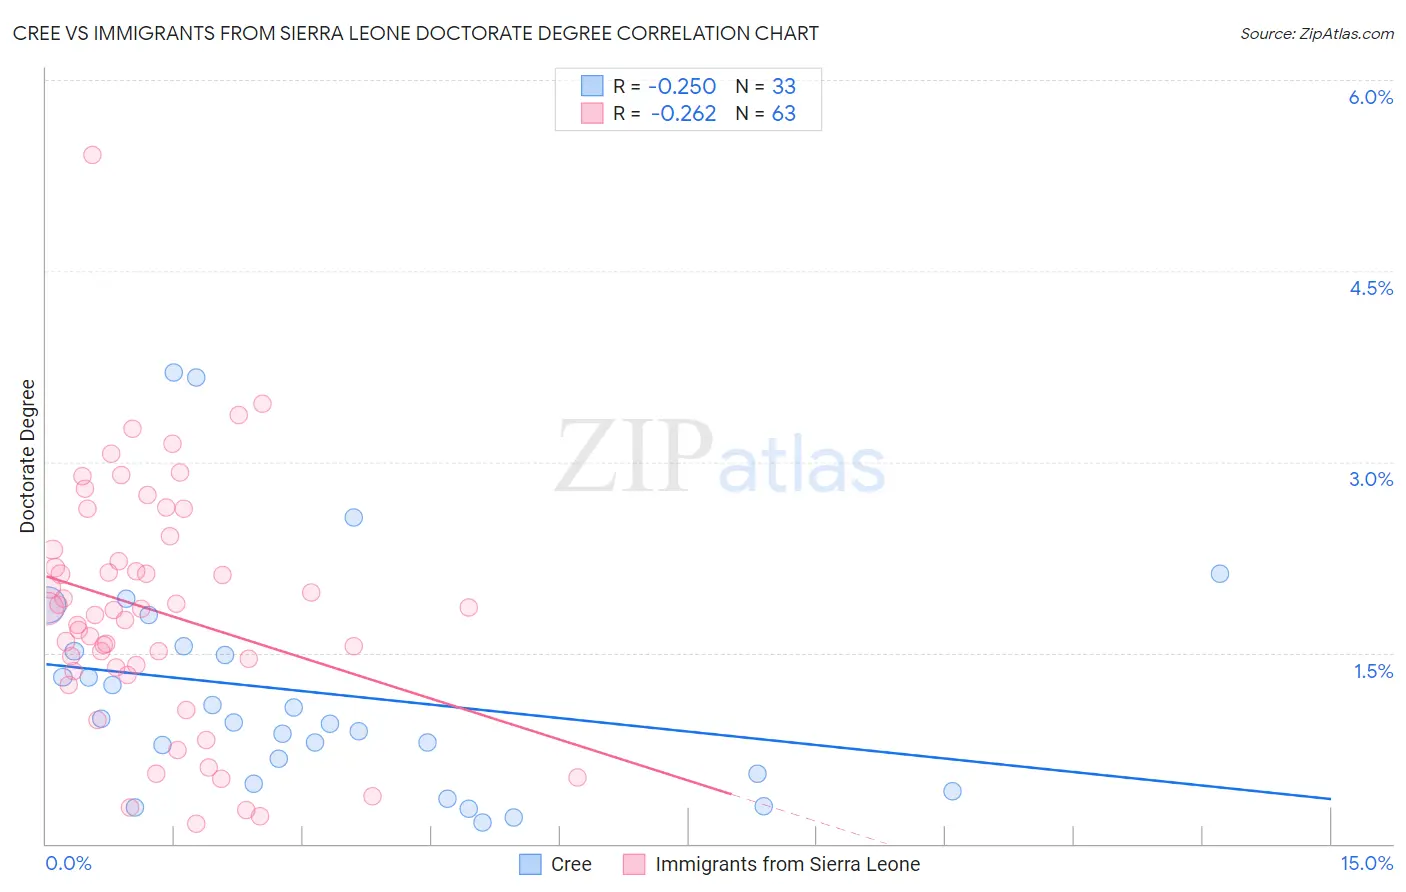
Cree vs Immigrants from Sierra Leone Doctorate Degree Correlation Chart
The statistical analysis conducted on geographies consisting of 75,903,599 people shows a weak negative correlation between the proportion of Cree and percentage of population with at least doctorate degree education in the United States with a correlation coefficient (R) of -0.250 and weighted average of 1.6%. Similarly, the statistical analysis conducted on geographies consisting of 101,401,278 people shows a weak negative correlation between the proportion of Immigrants from Sierra Leone and percentage of population with at least doctorate degree education in the United States with a correlation coefficient (R) of -0.262 and weighted average of 2.0%, a difference of 23.9%.
Doctorate Degree Correlation Summary
| Measurement | Cree | Immigrants from Sierra Leone |
| Minimum | 0.17% | 0.15% |
| Maximum | 3.7% | 5.4% |
| Range | 3.5% | 5.3% |
| Mean | 1.2% | 1.8% |
| Median | 0.95% | 1.8% |
| Interquartile 25% (IQ1) | 0.51% | 1.4% |
| Interquartile 75% (IQ3) | 1.5% | 2.3% |
| Interquartile Range (IQR) | 1.0% | 0.95% |
| Standard Deviation (Sample) | 0.88% | 0.95% |
| Standard Deviation (Population) | 0.87% | 0.94% |
Similar Demographics by Doctorate Degree
Demographics Similar to Cree by Doctorate Degree
In terms of doctorate degree, the demographic groups most similar to Cree are Hopi (1.6%, a difference of 0.21%), Indonesian (1.6%, a difference of 0.29%), Barbadian (1.6%, a difference of 0.36%), Guamanian/Chamorro (1.6%, a difference of 0.43%), and Iroquois (1.6%, a difference of 0.47%).
| Demographics | Rating | Rank | Doctorate Degree |
| Assyrians/Chaldeans/Syriacs | 5.9 /100 | #228 | Tragic 1.7% |
| Colville | 4.7 /100 | #229 | Tragic 1.6% |
| Immigrants | Philippines | 4.3 /100 | #230 | Tragic 1.6% |
| Immigrants | North Macedonia | 3.9 /100 | #231 | Tragic 1.6% |
| Guamanians/Chamorros | 3.3 /100 | #232 | Tragic 1.6% |
| Barbadians | 3.3 /100 | #233 | Tragic 1.6% |
| Hopi | 3.2 /100 | #234 | Tragic 1.6% |
| Cree | 3.0 /100 | #235 | Tragic 1.6% |
| Indonesians | 2.8 /100 | #236 | Tragic 1.6% |
| Iroquois | 2.7 /100 | #237 | Tragic 1.6% |
| Immigrants | Congo | 2.6 /100 | #238 | Tragic 1.6% |
| West Indians | 2.5 /100 | #239 | Tragic 1.6% |
| Immigrants | Panama | 2.4 /100 | #240 | Tragic 1.6% |
| Cheyenne | 2.3 /100 | #241 | Tragic 1.6% |
| Ottawa | 2.2 /100 | #242 | Tragic 1.6% |
Demographics Similar to Immigrants from Sierra Leone by Doctorate Degree
In terms of doctorate degree, the demographic groups most similar to Immigrants from Sierra Leone are Canadian (2.0%, a difference of 0.14%), Immigrants from Ukraine (2.0%, a difference of 0.14%), Scottish (2.0%, a difference of 0.28%), Immigrants from Uzbekistan (2.0%, a difference of 0.33%), and Immigrants from Zaire (2.0%, a difference of 0.36%).
| Demographics | Rating | Rank | Doctorate Degree |
| Ute | 93.2 /100 | #124 | Exceptional 2.0% |
| Moroccans | 93.0 /100 | #125 | Exceptional 2.0% |
| Jordanians | 92.1 /100 | #126 | Exceptional 2.0% |
| Palestinians | 92.0 /100 | #127 | Exceptional 2.0% |
| Immigrants | Zaire | 91.1 /100 | #128 | Exceptional 2.0% |
| Canadians | 90.6 /100 | #129 | Exceptional 2.0% |
| Immigrants | Ukraine | 90.5 /100 | #130 | Exceptional 2.0% |
| Immigrants | Sierra Leone | 90.2 /100 | #131 | Exceptional 2.0% |
| Scottish | 89.4 /100 | #132 | Excellent 2.0% |
| Immigrants | Uzbekistan | 89.3 /100 | #133 | Excellent 2.0% |
| Immigrants | Cameroon | 88.9 /100 | #134 | Excellent 2.0% |
| Serbians | 88.7 /100 | #135 | Excellent 2.0% |
| Swedes | 88.3 /100 | #136 | Excellent 2.0% |
| South American Indians | 88.3 /100 | #137 | Excellent 2.0% |
| Swiss | 88.0 /100 | #138 | Excellent 2.0% |