Cree vs Immigrants from Cambodia Doctorate Degree
COMPARE
Cree
Immigrants from Cambodia
Doctorate Degree
Doctorate Degree Comparison
Cree
Immigrants from Cambodia
1.6%
DOCTORATE DEGREE
3.0/ 100
METRIC RATING
235th/ 347
METRIC RANK
1.5%
DOCTORATE DEGREE
1.0/ 100
METRIC RATING
254th/ 347
METRIC RANK
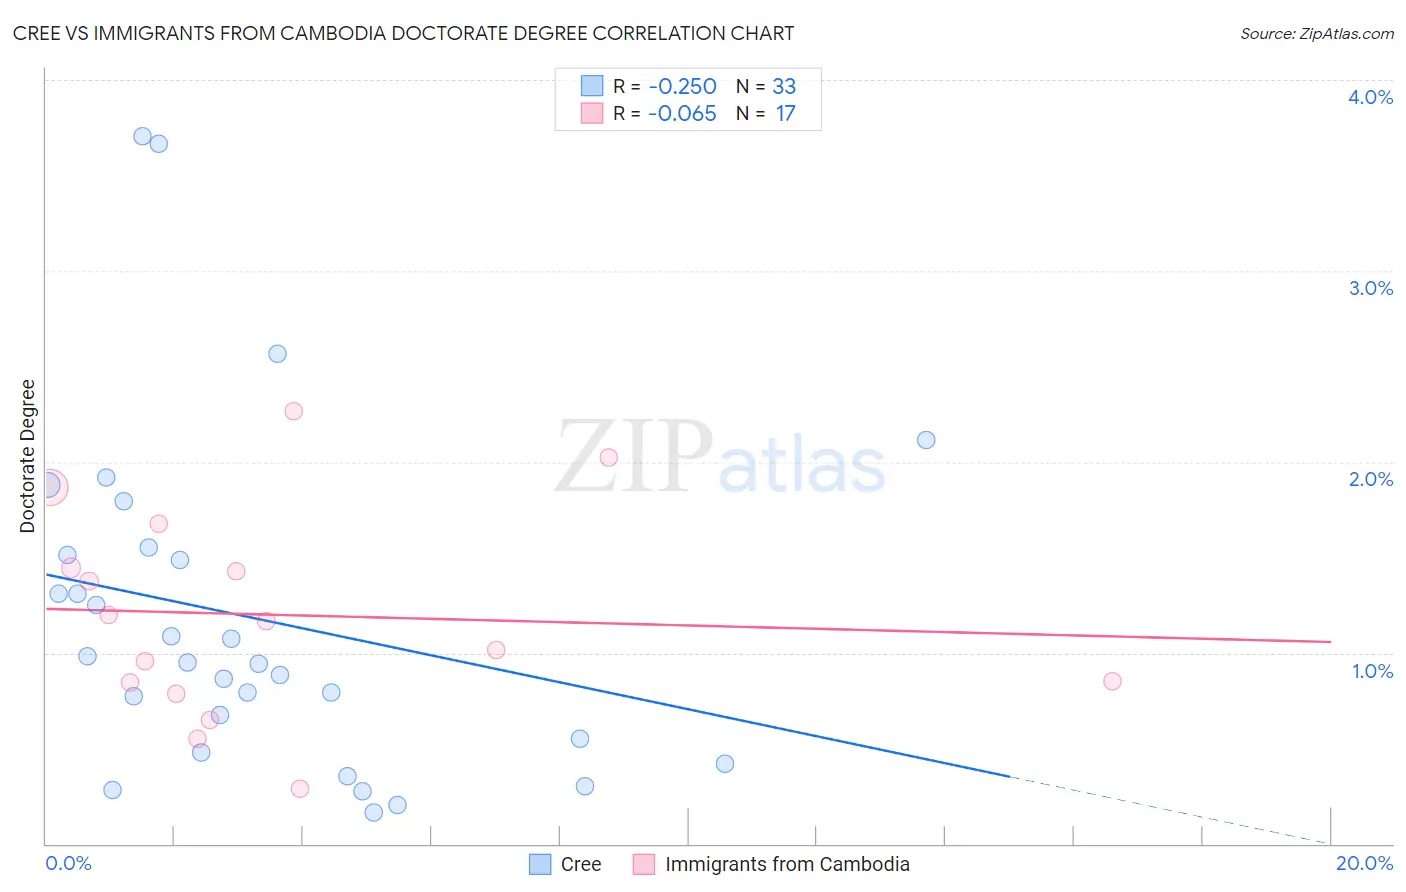
Cree vs Immigrants from Cambodia Doctorate Degree Correlation Chart
The statistical analysis conducted on geographies consisting of 75,903,599 people shows a weak negative correlation between the proportion of Cree and percentage of population with at least doctorate degree education in the United States with a correlation coefficient (R) of -0.250 and weighted average of 1.6%. Similarly, the statistical analysis conducted on geographies consisting of 204,355,186 people shows a slight negative correlation between the proportion of Immigrants from Cambodia and percentage of population with at least doctorate degree education in the United States with a correlation coefficient (R) of -0.065 and weighted average of 1.5%, a difference of 5.0%.
Doctorate Degree Correlation Summary
| Measurement | Cree | Immigrants from Cambodia |
| Minimum | 0.17% | 0.29% |
| Maximum | 3.7% | 2.3% |
| Range | 3.5% | 2.0% |
| Mean | 1.2% | 1.2% |
| Median | 0.95% | 1.2% |
| Interquartile 25% (IQ1) | 0.51% | 0.82% |
| Interquartile 75% (IQ3) | 1.5% | 1.6% |
| Interquartile Range (IQR) | 1.0% | 0.74% |
| Standard Deviation (Sample) | 0.88% | 0.54% |
| Standard Deviation (Population) | 0.87% | 0.53% |
Demographics Similar to Cree and Immigrants from Cambodia by Doctorate Degree
In terms of doctorate degree, the demographic groups most similar to Cree are Hopi (1.6%, a difference of 0.21%), Indonesian (1.6%, a difference of 0.29%), Iroquois (1.6%, a difference of 0.47%), Immigrants from Congo (1.6%, a difference of 0.68%), and West Indian (1.6%, a difference of 0.78%). Similarly, the demographic groups most similar to Immigrants from Cambodia are American (1.5%, a difference of 0.13%), Yuman (1.5%, a difference of 0.28%), Apache (1.5%, a difference of 1.2%), Immigrants from Fiji (1.6%, a difference of 2.1%), and Potawatomi (1.6%, a difference of 2.1%).
| Demographics | Rating | Rank | Doctorate Degree |
| Hopi | 3.2 /100 | #234 | Tragic 1.6% |
| Cree | 3.0 /100 | #235 | Tragic 1.6% |
| Indonesians | 2.8 /100 | #236 | Tragic 1.6% |
| Iroquois | 2.7 /100 | #237 | Tragic 1.6% |
| Immigrants | Congo | 2.6 /100 | #238 | Tragic 1.6% |
| West Indians | 2.5 /100 | #239 | Tragic 1.6% |
| Immigrants | Panama | 2.4 /100 | #240 | Tragic 1.6% |
| Cheyenne | 2.3 /100 | #241 | Tragic 1.6% |
| Ottawa | 2.2 /100 | #242 | Tragic 1.6% |
| Native Hawaiians | 2.1 /100 | #243 | Tragic 1.6% |
| French American Indians | 2.0 /100 | #244 | Tragic 1.6% |
| Delaware | 1.9 /100 | #245 | Tragic 1.6% |
| Hmong | 1.8 /100 | #246 | Tragic 1.6% |
| Comanche | 1.8 /100 | #247 | Tragic 1.6% |
| Africans | 1.8 /100 | #248 | Tragic 1.6% |
| Potawatomi | 1.6 /100 | #249 | Tragic 1.6% |
| Immigrants | Fiji | 1.6 /100 | #250 | Tragic 1.6% |
| Apache | 1.3 /100 | #251 | Tragic 1.5% |
| Yuman | 1.1 /100 | #252 | Tragic 1.5% |
| Americans | 1.0 /100 | #253 | Tragic 1.5% |
| Immigrants | Cambodia | 1.0 /100 | #254 | Tragic 1.5% |