Cree vs Somali Doctorate Degree
COMPARE
Cree
Somali
Doctorate Degree
Doctorate Degree Comparison
Cree
Somalis
1.6%
DOCTORATE DEGREE
3.0/ 100
METRIC RATING
235th/ 347
METRIC RANK
1.7%
DOCTORATE DEGREE
21.2/ 100
METRIC RATING
204th/ 347
METRIC RANK
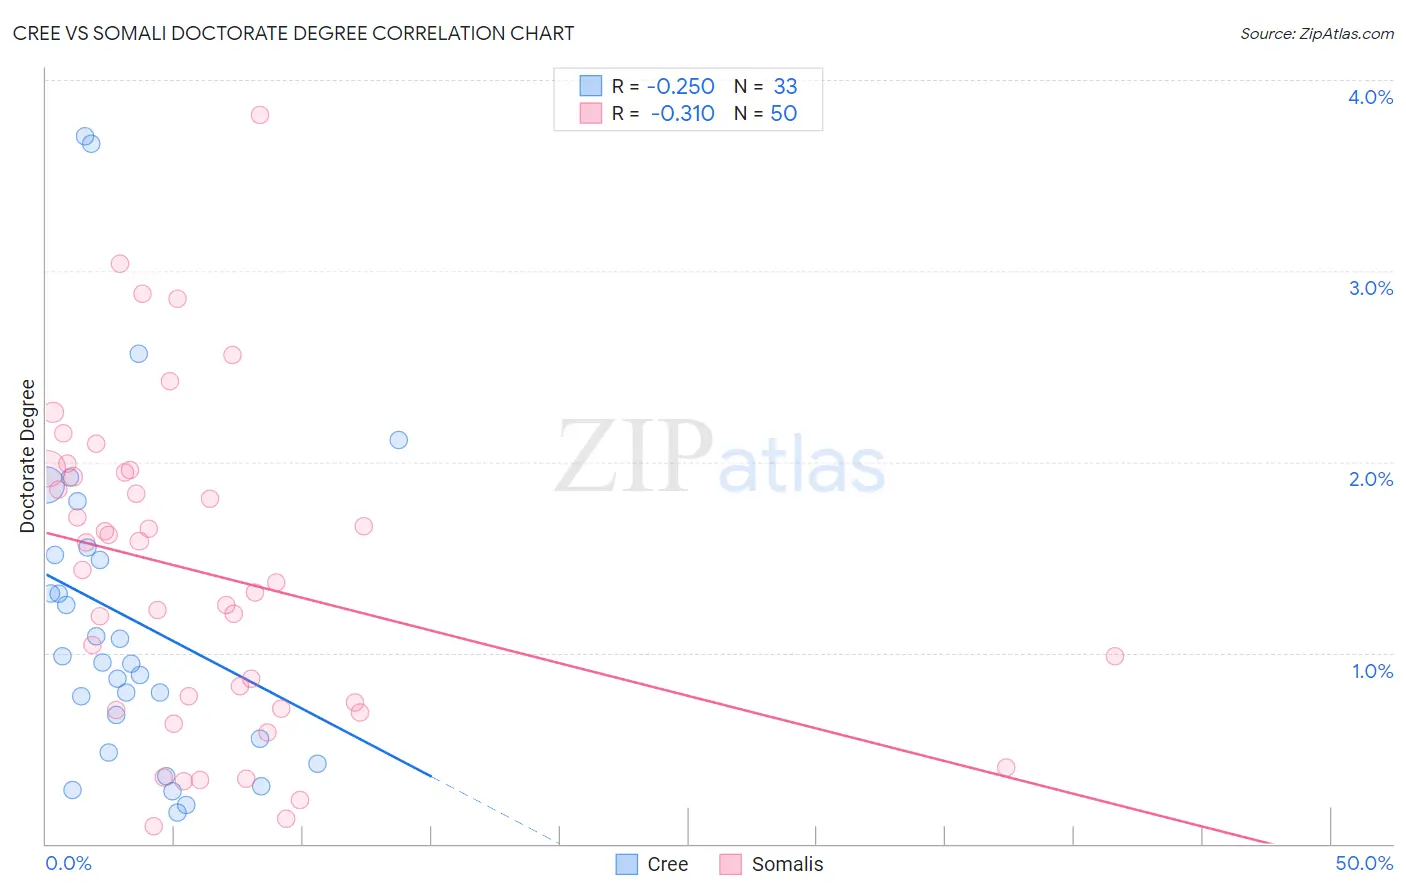
Cree vs Somali Doctorate Degree Correlation Chart
The statistical analysis conducted on geographies consisting of 75,903,599 people shows a weak negative correlation between the proportion of Cree and percentage of population with at least doctorate degree education in the United States with a correlation coefficient (R) of -0.250 and weighted average of 1.6%. Similarly, the statistical analysis conducted on geographies consisting of 99,087,953 people shows a mild negative correlation between the proportion of Somalis and percentage of population with at least doctorate degree education in the United States with a correlation coefficient (R) of -0.310 and weighted average of 1.7%, a difference of 9.1%.
Doctorate Degree Correlation Summary
| Measurement | Cree | Somali |
| Minimum | 0.17% | 0.094% |
| Maximum | 3.7% | 3.8% |
| Range | 3.5% | 3.7% |
| Mean | 1.2% | 1.4% |
| Median | 0.95% | 1.4% |
| Interquartile 25% (IQ1) | 0.51% | 0.70% |
| Interquartile 75% (IQ3) | 1.5% | 1.9% |
| Interquartile Range (IQR) | 1.0% | 1.2% |
| Standard Deviation (Sample) | 0.88% | 0.84% |
| Standard Deviation (Population) | 0.87% | 0.83% |
Similar Demographics by Doctorate Degree
Demographics Similar to Cree by Doctorate Degree
In terms of doctorate degree, the demographic groups most similar to Cree are Hopi (1.6%, a difference of 0.21%), Indonesian (1.6%, a difference of 0.29%), Barbadian (1.6%, a difference of 0.36%), Guamanian/Chamorro (1.6%, a difference of 0.43%), and Iroquois (1.6%, a difference of 0.47%).
| Demographics | Rating | Rank | Doctorate Degree |
| Assyrians/Chaldeans/Syriacs | 5.9 /100 | #228 | Tragic 1.7% |
| Colville | 4.7 /100 | #229 | Tragic 1.6% |
| Immigrants | Philippines | 4.3 /100 | #230 | Tragic 1.6% |
| Immigrants | North Macedonia | 3.9 /100 | #231 | Tragic 1.6% |
| Guamanians/Chamorros | 3.3 /100 | #232 | Tragic 1.6% |
| Barbadians | 3.3 /100 | #233 | Tragic 1.6% |
| Hopi | 3.2 /100 | #234 | Tragic 1.6% |
| Cree | 3.0 /100 | #235 | Tragic 1.6% |
| Indonesians | 2.8 /100 | #236 | Tragic 1.6% |
| Iroquois | 2.7 /100 | #237 | Tragic 1.6% |
| Immigrants | Congo | 2.6 /100 | #238 | Tragic 1.6% |
| West Indians | 2.5 /100 | #239 | Tragic 1.6% |
| Immigrants | Panama | 2.4 /100 | #240 | Tragic 1.6% |
| Cheyenne | 2.3 /100 | #241 | Tragic 1.6% |
| Ottawa | 2.2 /100 | #242 | Tragic 1.6% |
Demographics Similar to Somalis by Doctorate Degree
In terms of doctorate degree, the demographic groups most similar to Somalis are Immigrants from Vietnam (1.8%, a difference of 0.030%), Portuguese (1.8%, a difference of 0.050%), Immigrants from Nigeria (1.8%, a difference of 0.28%), White/Caucasian (1.8%, a difference of 0.35%), and Venezuelan (1.7%, a difference of 0.41%).
| Demographics | Rating | Rank | Doctorate Degree |
| Chinese | 25.1 /100 | #197 | Fair 1.8% |
| Immigrants | Ghana | 24.6 /100 | #198 | Fair 1.8% |
| Immigrants | South America | 23.3 /100 | #199 | Fair 1.8% |
| Whites/Caucasians | 22.8 /100 | #200 | Fair 1.8% |
| Immigrants | Nigeria | 22.4 /100 | #201 | Fair 1.8% |
| Portuguese | 21.4 /100 | #202 | Fair 1.8% |
| Immigrants | Vietnam | 21.4 /100 | #203 | Fair 1.8% |
| Somalis | 21.2 /100 | #204 | Fair 1.7% |
| Venezuelans | 19.5 /100 | #205 | Poor 1.7% |
| Immigrants | Peru | 17.6 /100 | #206 | Poor 1.7% |
| Yugoslavians | 17.1 /100 | #207 | Poor 1.7% |
| Colombians | 16.1 /100 | #208 | Poor 1.7% |
| Immigrants | Western Africa | 15.4 /100 | #209 | Poor 1.7% |
| Tongans | 15.1 /100 | #210 | Poor 1.7% |
| Immigrants | Armenia | 15.1 /100 | #211 | Poor 1.7% |