Cree vs Immigrants from Ethiopia Doctorate Degree
COMPARE
Cree
Immigrants from Ethiopia
Doctorate Degree
Doctorate Degree Comparison
Cree
Immigrants from Ethiopia
1.6%
DOCTORATE DEGREE
3.0/ 100
METRIC RATING
235th/ 347
METRIC RANK
2.4%
DOCTORATE DEGREE
100.0/ 100
METRIC RATING
57th/ 347
METRIC RANK
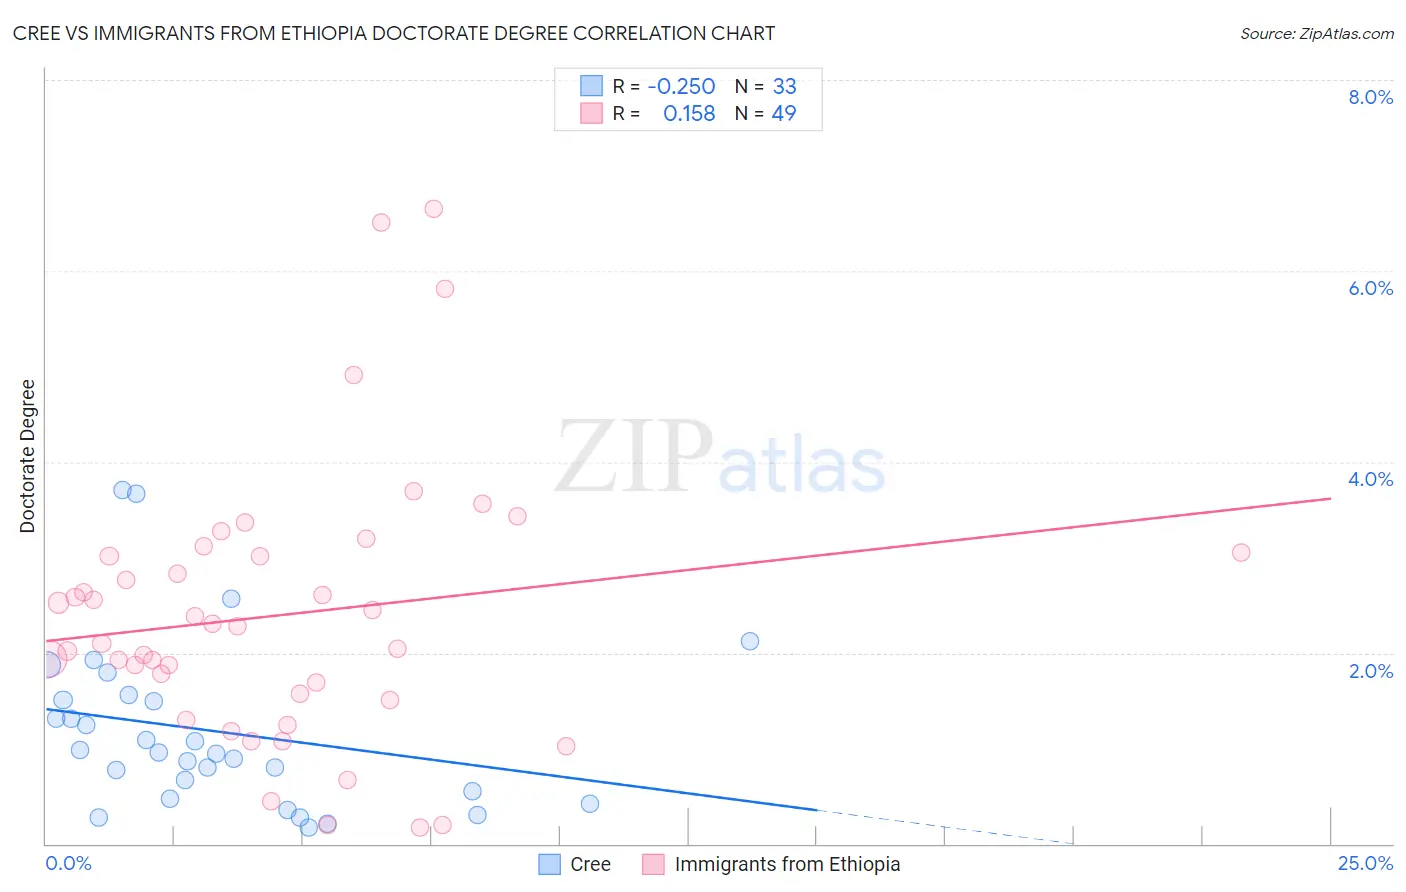
Cree vs Immigrants from Ethiopia Doctorate Degree Correlation Chart
The statistical analysis conducted on geographies consisting of 75,903,599 people shows a weak negative correlation between the proportion of Cree and percentage of population with at least doctorate degree education in the United States with a correlation coefficient (R) of -0.250 and weighted average of 1.6%. Similarly, the statistical analysis conducted on geographies consisting of 210,993,221 people shows a poor positive correlation between the proportion of Immigrants from Ethiopia and percentage of population with at least doctorate degree education in the United States with a correlation coefficient (R) of 0.158 and weighted average of 2.4%, a difference of 46.6%.
Doctorate Degree Correlation Summary
| Measurement | Cree | Immigrants from Ethiopia |
| Minimum | 0.17% | 0.18% |
| Maximum | 3.7% | 6.7% |
| Range | 3.5% | 6.5% |
| Mean | 1.2% | 2.4% |
| Median | 0.95% | 2.3% |
| Interquartile 25% (IQ1) | 0.51% | 1.5% |
| Interquartile 75% (IQ3) | 1.5% | 3.0% |
| Interquartile Range (IQR) | 1.0% | 1.5% |
| Standard Deviation (Sample) | 0.88% | 1.4% |
| Standard Deviation (Population) | 0.87% | 1.4% |
Similar Demographics by Doctorate Degree
Demographics Similar to Cree by Doctorate Degree
In terms of doctorate degree, the demographic groups most similar to Cree are Hopi (1.6%, a difference of 0.21%), Indonesian (1.6%, a difference of 0.29%), Barbadian (1.6%, a difference of 0.36%), Guamanian/Chamorro (1.6%, a difference of 0.43%), and Iroquois (1.6%, a difference of 0.47%).
| Demographics | Rating | Rank | Doctorate Degree |
| Assyrians/Chaldeans/Syriacs | 5.9 /100 | #228 | Tragic 1.7% |
| Colville | 4.7 /100 | #229 | Tragic 1.6% |
| Immigrants | Philippines | 4.3 /100 | #230 | Tragic 1.6% |
| Immigrants | North Macedonia | 3.9 /100 | #231 | Tragic 1.6% |
| Guamanians/Chamorros | 3.3 /100 | #232 | Tragic 1.6% |
| Barbadians | 3.3 /100 | #233 | Tragic 1.6% |
| Hopi | 3.2 /100 | #234 | Tragic 1.6% |
| Cree | 3.0 /100 | #235 | Tragic 1.6% |
| Indonesians | 2.8 /100 | #236 | Tragic 1.6% |
| Iroquois | 2.7 /100 | #237 | Tragic 1.6% |
| Immigrants | Congo | 2.6 /100 | #238 | Tragic 1.6% |
| West Indians | 2.5 /100 | #239 | Tragic 1.6% |
| Immigrants | Panama | 2.4 /100 | #240 | Tragic 1.6% |
| Cheyenne | 2.3 /100 | #241 | Tragic 1.6% |
| Ottawa | 2.2 /100 | #242 | Tragic 1.6% |
Demographics Similar to Immigrants from Ethiopia by Doctorate Degree
In terms of doctorate degree, the demographic groups most similar to Immigrants from Ethiopia are Ethiopian (2.3%, a difference of 0.12%), Immigrants from Czechoslovakia (2.4%, a difference of 0.44%), Bolivian (2.4%, a difference of 0.53%), South African (2.3%, a difference of 0.56%), and Immigrants from Serbia (2.3%, a difference of 0.58%).
| Demographics | Rating | Rank | Doctorate Degree |
| Immigrants | Norway | 100.0 /100 | #50 | Exceptional 2.4% |
| Australians | 100.0 /100 | #51 | Exceptional 2.4% |
| Bulgarians | 100.0 /100 | #52 | Exceptional 2.4% |
| Immigrants | Latvia | 100.0 /100 | #53 | Exceptional 2.4% |
| Immigrants | Indonesia | 100.0 /100 | #54 | Exceptional 2.4% |
| Bolivians | 100.0 /100 | #55 | Exceptional 2.4% |
| Immigrants | Czechoslovakia | 100.0 /100 | #56 | Exceptional 2.4% |
| Immigrants | Ethiopia | 100.0 /100 | #57 | Exceptional 2.4% |
| Ethiopians | 99.9 /100 | #58 | Exceptional 2.3% |
| South Africans | 99.9 /100 | #59 | Exceptional 2.3% |
| Immigrants | Serbia | 99.9 /100 | #60 | Exceptional 2.3% |
| Bhutanese | 99.9 /100 | #61 | Exceptional 2.3% |
| Immigrants | Europe | 99.9 /100 | #62 | Exceptional 2.3% |
| Laotians | 99.9 /100 | #63 | Exceptional 2.3% |
| Immigrants | Greece | 99.9 /100 | #64 | Exceptional 2.3% |