Taiwanese vs Immigrants from Belize Doctorate Degree
COMPARE
Taiwanese
Immigrants from Belize
Doctorate Degree
Doctorate Degree Comparison
Taiwanese
Immigrants from Belize
2.1%
DOCTORATE DEGREE
96.7/ 100
METRIC RATING
115th/ 347
METRIC RANK
1.3%
DOCTORATE DEGREE
0.1/ 100
METRIC RATING
323rd/ 347
METRIC RANK
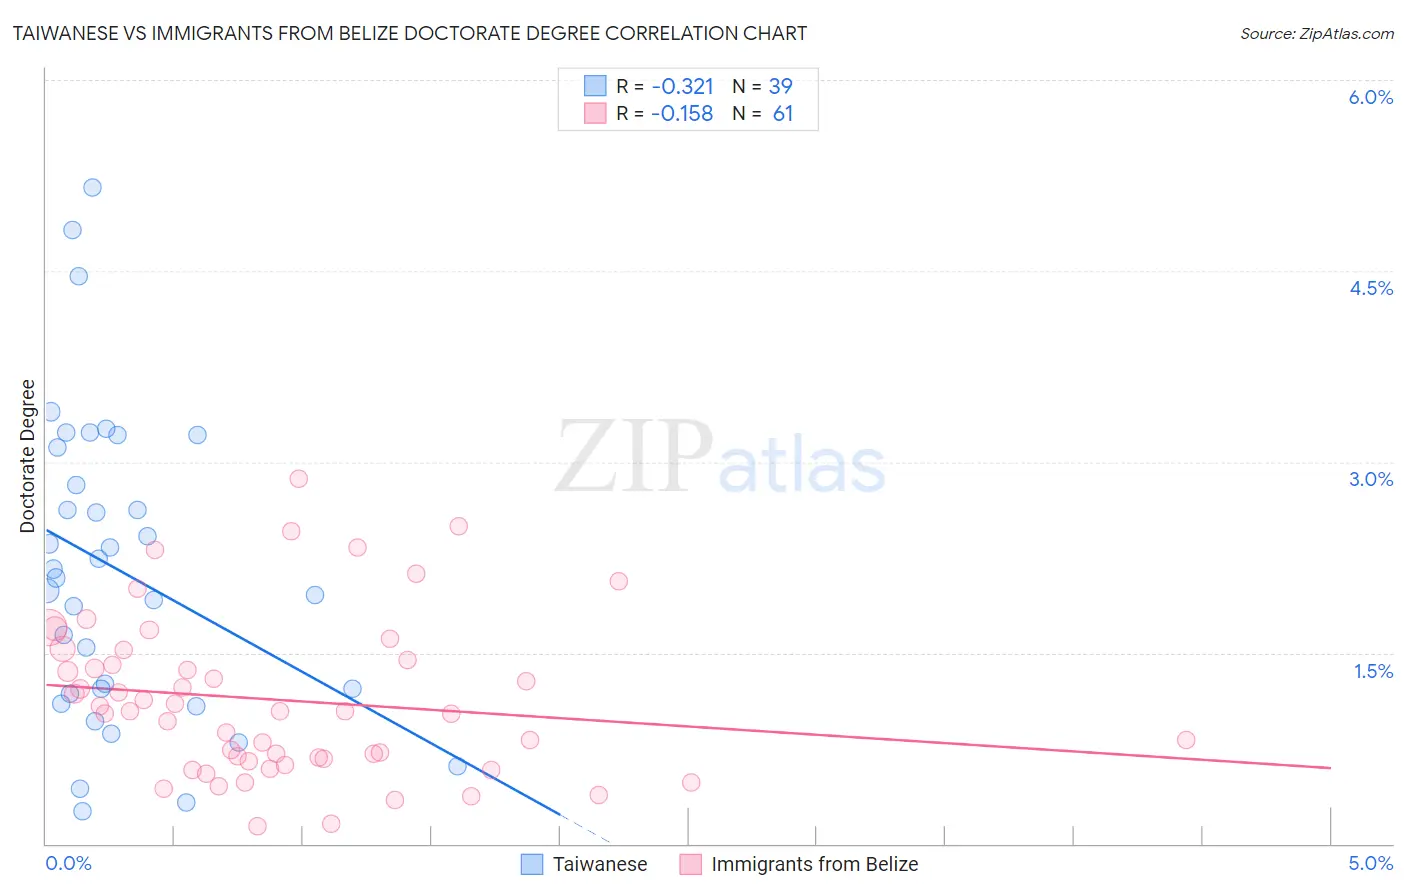
Taiwanese vs Immigrants from Belize Doctorate Degree Correlation Chart
The statistical analysis conducted on geographies consisting of 31,440,416 people shows a mild negative correlation between the proportion of Taiwanese and percentage of population with at least doctorate degree education in the United States with a correlation coefficient (R) of -0.321 and weighted average of 2.1%. Similarly, the statistical analysis conducted on geographies consisting of 129,933,258 people shows a poor negative correlation between the proportion of Immigrants from Belize and percentage of population with at least doctorate degree education in the United States with a correlation coefficient (R) of -0.158 and weighted average of 1.3%, a difference of 55.6%.
Doctorate Degree Correlation Summary
| Measurement | Taiwanese | Immigrants from Belize |
| Minimum | 0.25% | 0.14% |
| Maximum | 5.2% | 2.9% |
| Range | 4.9% | 2.7% |
| Mean | 2.1% | 1.1% |
| Median | 2.1% | 1.0% |
| Interquartile 25% (IQ1) | 1.2% | 0.66% |
| Interquartile 75% (IQ3) | 3.1% | 1.5% |
| Interquartile Range (IQR) | 1.9% | 0.82% |
| Standard Deviation (Sample) | 1.2% | 0.62% |
| Standard Deviation (Population) | 1.2% | 0.62% |
Similar Demographics by Doctorate Degree
Demographics Similar to Taiwanese by Doctorate Degree
In terms of doctorate degree, the demographic groups most similar to Taiwanese are Immigrants from Croatia (2.1%, a difference of 0.080%), Immigrants from Italy (2.1%, a difference of 0.23%), Syrian (2.1%, a difference of 0.44%), Immigrants from Pakistan (2.1%, a difference of 0.46%), and Maltese (2.1%, a difference of 0.46%).
| Demographics | Rating | Rank | Doctorate Degree |
| Immigrants | Germany | 97.3 /100 | #108 | Exceptional 2.1% |
| Ukrainians | 97.2 /100 | #109 | Exceptional 2.1% |
| Brazilians | 97.2 /100 | #110 | Exceptional 2.1% |
| Immigrants | Pakistan | 97.1 /100 | #111 | Exceptional 2.1% |
| Syrians | 97.1 /100 | #112 | Exceptional 2.1% |
| Immigrants | Italy | 96.9 /100 | #113 | Exceptional 2.1% |
| Immigrants | Croatia | 96.8 /100 | #114 | Exceptional 2.1% |
| Taiwanese | 96.7 /100 | #115 | Exceptional 2.1% |
| Maltese | 96.2 /100 | #116 | Exceptional 2.1% |
| Lebanese | 96.0 /100 | #117 | Exceptional 2.1% |
| Icelanders | 96.0 /100 | #118 | Exceptional 2.1% |
| Pakistanis | 95.8 /100 | #119 | Exceptional 2.0% |
| Immigrants | Morocco | 95.5 /100 | #120 | Exceptional 2.0% |
| Immigrants | Jordan | 94.8 /100 | #121 | Exceptional 2.0% |
| Immigrants | Southern Europe | 94.7 /100 | #122 | Exceptional 2.0% |
Demographics Similar to Immigrants from Belize by Doctorate Degree
In terms of doctorate degree, the demographic groups most similar to Immigrants from Belize are Seminole (1.3%, a difference of 0.20%), Dutch West Indian (1.3%, a difference of 0.26%), Native/Alaskan (1.3%, a difference of 0.32%), Immigrants from St. Vincent and the Grenadines (1.3%, a difference of 0.36%), and Immigrants from Guyana (1.3%, a difference of 0.43%).
| Demographics | Rating | Rank | Doctorate Degree |
| Navajo | 0.1 /100 | #316 | Tragic 1.4% |
| Immigrants | Micronesia | 0.1 /100 | #317 | Tragic 1.3% |
| Creek | 0.1 /100 | #318 | Tragic 1.3% |
| Immigrants | Guyana | 0.1 /100 | #319 | Tragic 1.3% |
| Immigrants | St. Vincent and the Grenadines | 0.1 /100 | #320 | Tragic 1.3% |
| Dutch West Indians | 0.1 /100 | #321 | Tragic 1.3% |
| Seminole | 0.1 /100 | #322 | Tragic 1.3% |
| Immigrants | Belize | 0.1 /100 | #323 | Tragic 1.3% |
| Natives/Alaskans | 0.0 /100 | #324 | Tragic 1.3% |
| Pima | 0.0 /100 | #325 | Tragic 1.3% |
| Immigrants | Cabo Verde | 0.0 /100 | #326 | Tragic 1.3% |
| Hispanics or Latinos | 0.0 /100 | #327 | Tragic 1.3% |
| Inupiat | 0.0 /100 | #328 | Tragic 1.3% |
| Haitians | 0.0 /100 | #329 | Tragic 1.3% |
| Yup'ik | 0.0 /100 | #330 | Tragic 1.3% |