Cree vs Polish Doctorate Degree
COMPARE
Cree
Polish
Doctorate Degree
Doctorate Degree Comparison
Cree
Poles
1.6%
DOCTORATE DEGREE
3.0/ 100
METRIC RATING
235th/ 347
METRIC RANK
1.9%
DOCTORATE DEGREE
72.7/ 100
METRIC RATING
155th/ 347
METRIC RANK
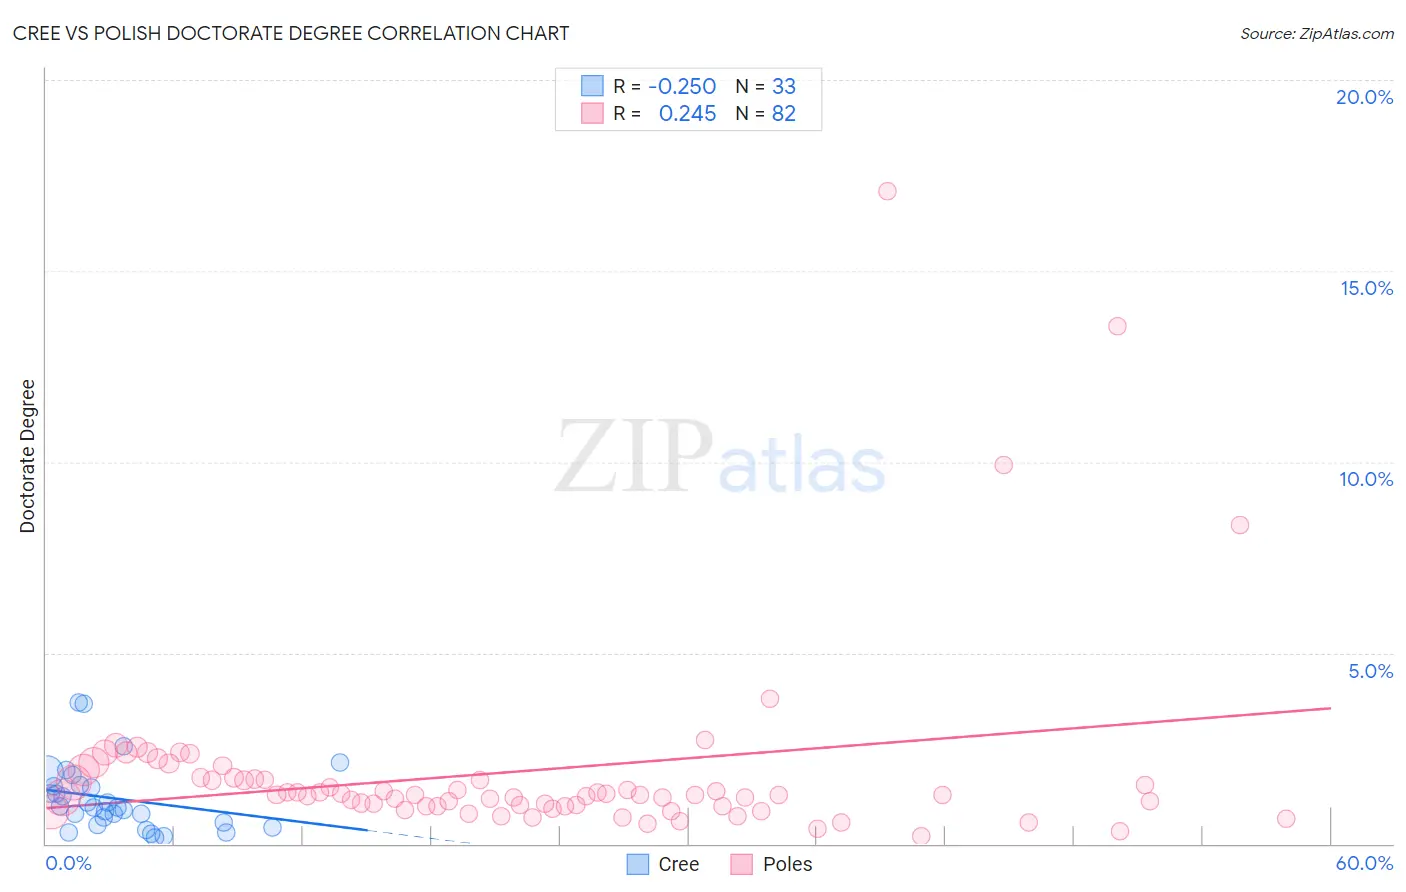
Cree vs Polish Doctorate Degree Correlation Chart
The statistical analysis conducted on geographies consisting of 75,903,599 people shows a weak negative correlation between the proportion of Cree and percentage of population with at least doctorate degree education in the United States with a correlation coefficient (R) of -0.250 and weighted average of 1.6%. Similarly, the statistical analysis conducted on geographies consisting of 539,143,774 people shows a weak positive correlation between the proportion of Poles and percentage of population with at least doctorate degree education in the United States with a correlation coefficient (R) of 0.245 and weighted average of 1.9%, a difference of 18.7%.
Doctorate Degree Correlation Summary
| Measurement | Cree | Polish |
| Minimum | 0.17% | 0.20% |
| Maximum | 3.7% | 17.1% |
| Range | 3.5% | 16.9% |
| Mean | 1.2% | 1.9% |
| Median | 0.95% | 1.3% |
| Interquartile 25% (IQ1) | 0.51% | 0.98% |
| Interquartile 75% (IQ3) | 1.5% | 1.7% |
| Interquartile Range (IQR) | 1.0% | 0.71% |
| Standard Deviation (Sample) | 0.88% | 2.5% |
| Standard Deviation (Population) | 0.87% | 2.5% |
Similar Demographics by Doctorate Degree
Demographics Similar to Cree by Doctorate Degree
In terms of doctorate degree, the demographic groups most similar to Cree are Hopi (1.6%, a difference of 0.21%), Indonesian (1.6%, a difference of 0.29%), Barbadian (1.6%, a difference of 0.36%), Guamanian/Chamorro (1.6%, a difference of 0.43%), and Iroquois (1.6%, a difference of 0.47%).
| Demographics | Rating | Rank | Doctorate Degree |
| Assyrians/Chaldeans/Syriacs | 5.9 /100 | #228 | Tragic 1.7% |
| Colville | 4.7 /100 | #229 | Tragic 1.6% |
| Immigrants | Philippines | 4.3 /100 | #230 | Tragic 1.6% |
| Immigrants | North Macedonia | 3.9 /100 | #231 | Tragic 1.6% |
| Guamanians/Chamorros | 3.3 /100 | #232 | Tragic 1.6% |
| Barbadians | 3.3 /100 | #233 | Tragic 1.6% |
| Hopi | 3.2 /100 | #234 | Tragic 1.6% |
| Cree | 3.0 /100 | #235 | Tragic 1.6% |
| Indonesians | 2.8 /100 | #236 | Tragic 1.6% |
| Iroquois | 2.7 /100 | #237 | Tragic 1.6% |
| Immigrants | Congo | 2.6 /100 | #238 | Tragic 1.6% |
| West Indians | 2.5 /100 | #239 | Tragic 1.6% |
| Immigrants | Panama | 2.4 /100 | #240 | Tragic 1.6% |
| Cheyenne | 2.3 /100 | #241 | Tragic 1.6% |
| Ottawa | 2.2 /100 | #242 | Tragic 1.6% |
Demographics Similar to Poles by Doctorate Degree
In terms of doctorate degree, the demographic groups most similar to Poles are Immigrants from Albania (1.9%, a difference of 0.020%), Slavic (1.9%, a difference of 0.060%), Danish (1.9%, a difference of 0.14%), Hungarian (1.9%, a difference of 0.17%), and Immigrants from Oceania (1.9%, a difference of 0.24%).
| Demographics | Rating | Rank | Doctorate Degree |
| Luxembourgers | 81.1 /100 | #148 | Excellent 1.9% |
| Basques | 76.9 /100 | #149 | Good 1.9% |
| English | 75.9 /100 | #150 | Good 1.9% |
| Albanians | 74.8 /100 | #151 | Good 1.9% |
| Immigrants | Kenya | 74.3 /100 | #152 | Good 1.9% |
| Immigrants | Oceania | 74.0 /100 | #153 | Good 1.9% |
| Immigrants | Albania | 72.8 /100 | #154 | Good 1.9% |
| Poles | 72.7 /100 | #155 | Good 1.9% |
| Slavs | 72.4 /100 | #156 | Good 1.9% |
| Danes | 71.9 /100 | #157 | Good 1.9% |
| Hungarians | 71.7 /100 | #158 | Good 1.9% |
| Slovenes | 70.2 /100 | #159 | Good 1.9% |
| Welsh | 69.7 /100 | #160 | Good 1.9% |
| Immigrants | Middle Africa | 68.8 /100 | #161 | Good 1.9% |
| Irish | 67.5 /100 | #162 | Good 1.9% |