Immigrants from Malaysia vs German Master's Degree
COMPARE
Immigrants from Malaysia
German
Master's Degree
Master's Degree Comparison
Immigrants from Malaysia
Germans
18.9%
MASTER'S DEGREE
100.0/ 100
METRIC RATING
44th/ 347
METRIC RANK
14.0%
MASTER'S DEGREE
13.1/ 100
METRIC RATING
220th/ 347
METRIC RANK
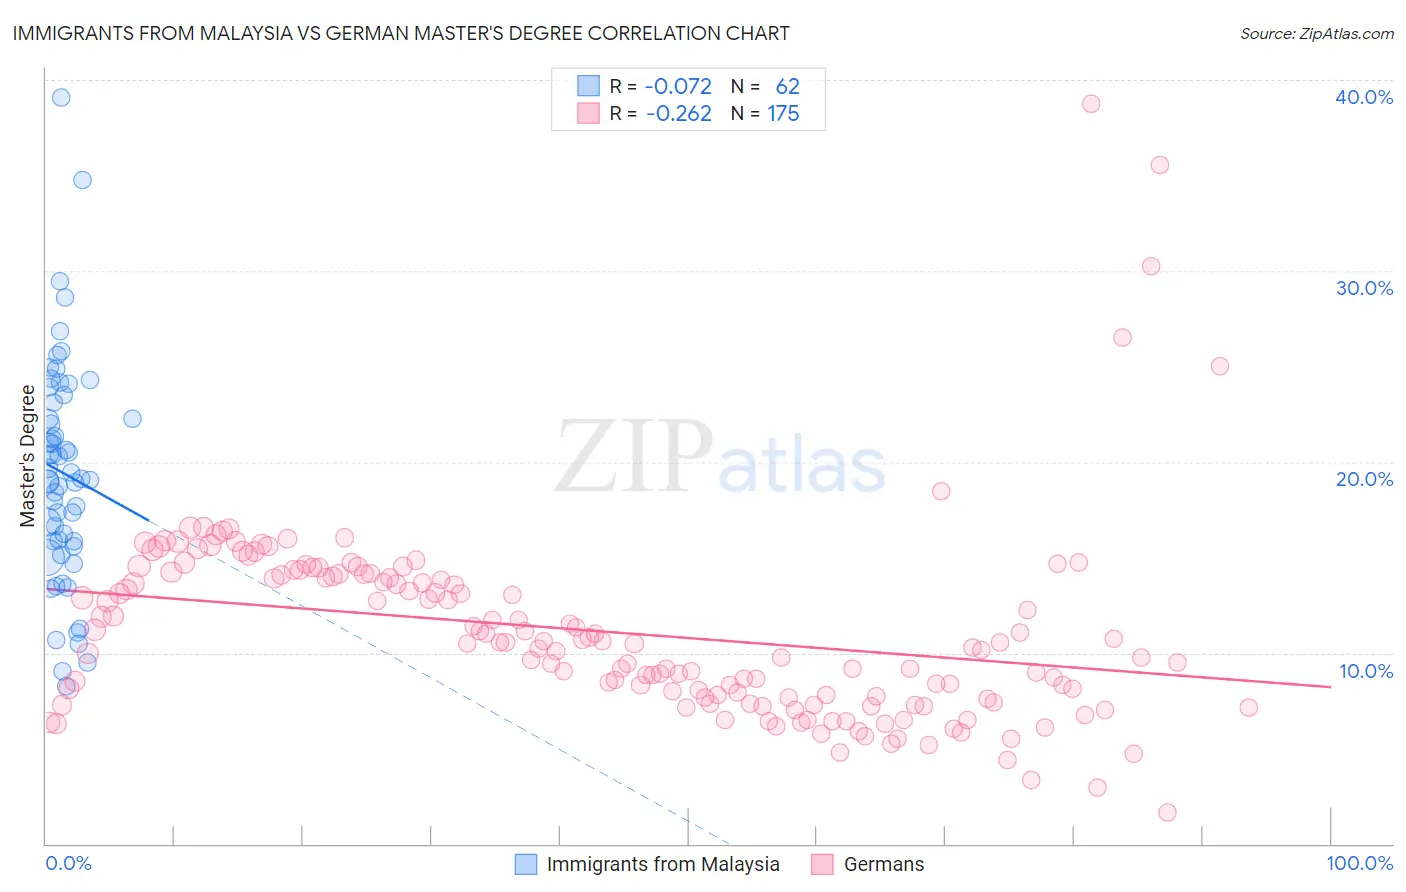
Immigrants from Malaysia vs German Master's Degree Correlation Chart
The statistical analysis conducted on geographies consisting of 197,962,385 people shows a slight negative correlation between the proportion of Immigrants from Malaysia and percentage of population with at least master's degree education in the United States with a correlation coefficient (R) of -0.072 and weighted average of 18.9%. Similarly, the statistical analysis conducted on geographies consisting of 579,621,104 people shows a weak negative correlation between the proportion of Germans and percentage of population with at least master's degree education in the United States with a correlation coefficient (R) of -0.262 and weighted average of 14.0%, a difference of 34.9%.
Master's Degree Correlation Summary
| Measurement | Immigrants from Malaysia | German |
| Minimum | 8.3% | 1.7% |
| Maximum | 39.1% | 38.7% |
| Range | 30.8% | 37.1% |
| Mean | 19.4% | 11.1% |
| Median | 19.1% | 10.5% |
| Interquartile 25% (IQ1) | 15.8% | 7.6% |
| Interquartile 75% (IQ3) | 23.1% | 14.0% |
| Interquartile Range (IQR) | 7.3% | 6.4% |
| Standard Deviation (Sample) | 5.9% | 5.0% |
| Standard Deviation (Population) | 5.8% | 5.0% |
Similar Demographics by Master's Degree
Demographics Similar to Immigrants from Malaysia by Master's Degree
In terms of master's degree, the demographic groups most similar to Immigrants from Malaysia are Immigrants from Belarus (18.9%, a difference of 0.11%), Immigrants from Greece (19.0%, a difference of 0.28%), Immigrants from Saudi Arabia (19.0%, a difference of 0.29%), Immigrants from Norway (18.8%, a difference of 0.50%), and Immigrants from Austria (18.8%, a difference of 0.51%).
| Demographics | Rating | Rank | Master's Degree |
| Mongolians | 100.0 /100 | #37 | Exceptional 19.4% |
| Bolivians | 100.0 /100 | #38 | Exceptional 19.3% |
| Immigrants | Spain | 100.0 /100 | #39 | Exceptional 19.1% |
| Immigrants | Bolivia | 100.0 /100 | #40 | Exceptional 19.1% |
| Immigrants | Latvia | 100.0 /100 | #41 | Exceptional 19.1% |
| Immigrants | Saudi Arabia | 100.0 /100 | #42 | Exceptional 19.0% |
| Immigrants | Greece | 100.0 /100 | #43 | Exceptional 19.0% |
| Immigrants | Malaysia | 100.0 /100 | #44 | Exceptional 18.9% |
| Immigrants | Belarus | 100.0 /100 | #45 | Exceptional 18.9% |
| Immigrants | Norway | 100.0 /100 | #46 | Exceptional 18.8% |
| Immigrants | Austria | 100.0 /100 | #47 | Exceptional 18.8% |
| Paraguayans | 100.0 /100 | #48 | Exceptional 18.8% |
| Estonians | 100.0 /100 | #49 | Exceptional 18.8% |
| Bulgarians | 100.0 /100 | #50 | Exceptional 18.8% |
| Immigrants | South Africa | 100.0 /100 | #51 | Exceptional 18.8% |
Demographics Similar to Germans by Master's Degree
In terms of master's degree, the demographic groups most similar to Germans are Korean (14.0%, a difference of 0.13%), Norwegian (14.0%, a difference of 0.15%), Ecuadorian (14.0%, a difference of 0.17%), Immigrants from South Eastern Asia (14.0%, a difference of 0.37%), and Immigrants from Grenada (14.0%, a difference of 0.41%).
| Demographics | Rating | Rank | Master's Degree |
| Immigrants | Thailand | 17.0 /100 | #213 | Poor 14.2% |
| Finns | 16.9 /100 | #214 | Poor 14.2% |
| Immigrants | Vietnam | 16.1 /100 | #215 | Poor 14.1% |
| Immigrants | Somalia | 15.8 /100 | #216 | Poor 14.1% |
| Immigrants | Trinidad and Tobago | 15.8 /100 | #217 | Poor 14.1% |
| French Canadians | 14.9 /100 | #218 | Poor 14.1% |
| Norwegians | 13.6 /100 | #219 | Poor 14.0% |
| Germans | 13.1 /100 | #220 | Poor 14.0% |
| Koreans | 12.7 /100 | #221 | Poor 14.0% |
| Ecuadorians | 12.6 /100 | #222 | Poor 14.0% |
| Immigrants | South Eastern Asia | 11.9 /100 | #223 | Poor 14.0% |
| Immigrants | Grenada | 11.8 /100 | #224 | Poor 14.0% |
| Portuguese | 11.2 /100 | #225 | Poor 13.9% |
| Immigrants | St. Vincent and the Grenadines | 11.0 /100 | #226 | Poor 13.9% |
| Immigrants | West Indies | 9.8 /100 | #227 | Tragic 13.9% |