Immigrants from Western Asia vs German Master's Degree
COMPARE
Immigrants from Western Asia
German
Master's Degree
Master's Degree Comparison
Immigrants from Western Asia
Germans
17.5%
MASTER'S DEGREE
99.5/ 100
METRIC RATING
81st/ 347
METRIC RANK
14.0%
MASTER'S DEGREE
13.1/ 100
METRIC RATING
220th/ 347
METRIC RANK
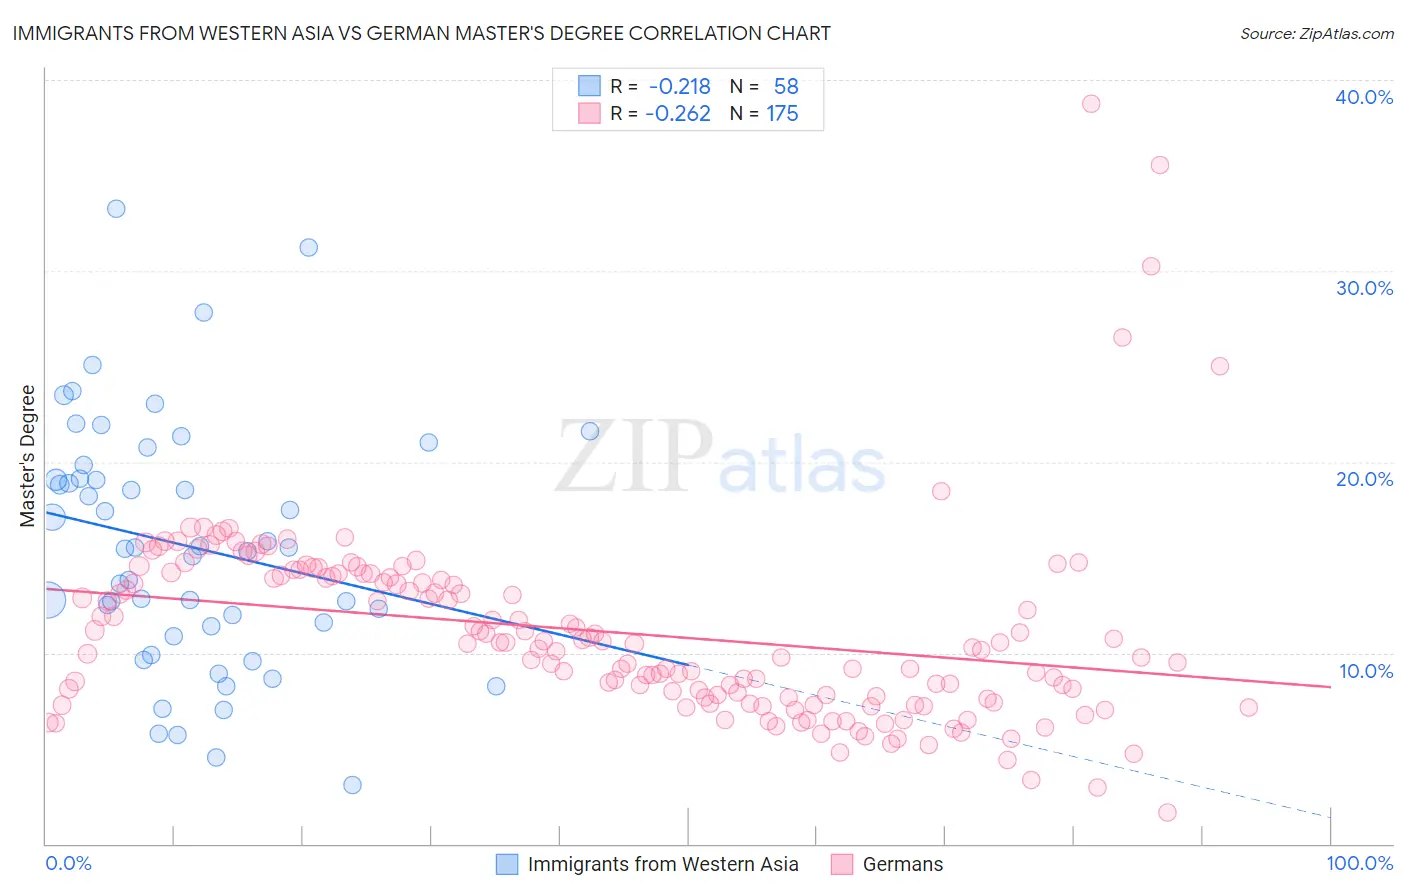
Immigrants from Western Asia vs German Master's Degree Correlation Chart
The statistical analysis conducted on geographies consisting of 404,328,411 people shows a weak negative correlation between the proportion of Immigrants from Western Asia and percentage of population with at least master's degree education in the United States with a correlation coefficient (R) of -0.218 and weighted average of 17.5%. Similarly, the statistical analysis conducted on geographies consisting of 579,621,104 people shows a weak negative correlation between the proportion of Germans and percentage of population with at least master's degree education in the United States with a correlation coefficient (R) of -0.262 and weighted average of 14.0%, a difference of 24.5%.
Master's Degree Correlation Summary
| Measurement | Immigrants from Western Asia | German |
| Minimum | 3.1% | 1.7% |
| Maximum | 33.2% | 38.7% |
| Range | 30.2% | 37.1% |
| Mean | 15.6% | 11.1% |
| Median | 15.5% | 10.5% |
| Interquartile 25% (IQ1) | 11.4% | 7.6% |
| Interquartile 75% (IQ3) | 19.1% | 14.0% |
| Interquartile Range (IQR) | 7.8% | 6.4% |
| Standard Deviation (Sample) | 6.4% | 5.0% |
| Standard Deviation (Population) | 6.4% | 5.0% |
Similar Demographics by Master's Degree
Demographics Similar to Immigrants from Western Asia by Master's Degree
In terms of master's degree, the demographic groups most similar to Immigrants from Western Asia are Greek (17.5%, a difference of 0.050%), Immigrants from Zimbabwe (17.4%, a difference of 0.11%), Carpatho Rusyn (17.5%, a difference of 0.30%), Immigrants from Lebanon (17.5%, a difference of 0.35%), and Immigrants from Scotland (17.4%, a difference of 0.44%).
| Demographics | Rating | Rank | Master's Degree |
| Immigrants | Romania | 99.7 /100 | #74 | Exceptional 17.7% |
| Egyptians | 99.6 /100 | #75 | Exceptional 17.6% |
| Immigrants | Indonesia | 99.6 /100 | #76 | Exceptional 17.6% |
| Immigrants | Eastern Europe | 99.6 /100 | #77 | Exceptional 17.6% |
| Immigrants | Hungary | 99.6 /100 | #78 | Exceptional 17.5% |
| Immigrants | Lebanon | 99.6 /100 | #79 | Exceptional 17.5% |
| Carpatho Rusyns | 99.6 /100 | #80 | Exceptional 17.5% |
| Immigrants | Western Asia | 99.5 /100 | #81 | Exceptional 17.5% |
| Greeks | 99.5 /100 | #82 | Exceptional 17.5% |
| Immigrants | Zimbabwe | 99.5 /100 | #83 | Exceptional 17.4% |
| Immigrants | Scotland | 99.4 /100 | #84 | Exceptional 17.4% |
| Immigrants | Brazil | 99.4 /100 | #85 | Exceptional 17.4% |
| Immigrants | Croatia | 99.3 /100 | #86 | Exceptional 17.3% |
| Maltese | 99.3 /100 | #87 | Exceptional 17.3% |
| Immigrants | Canada | 99.2 /100 | #88 | Exceptional 17.2% |
Demographics Similar to Germans by Master's Degree
In terms of master's degree, the demographic groups most similar to Germans are Korean (14.0%, a difference of 0.13%), Norwegian (14.0%, a difference of 0.15%), Ecuadorian (14.0%, a difference of 0.17%), Immigrants from South Eastern Asia (14.0%, a difference of 0.37%), and Immigrants from Grenada (14.0%, a difference of 0.41%).
| Demographics | Rating | Rank | Master's Degree |
| Immigrants | Thailand | 17.0 /100 | #213 | Poor 14.2% |
| Finns | 16.9 /100 | #214 | Poor 14.2% |
| Immigrants | Vietnam | 16.1 /100 | #215 | Poor 14.1% |
| Immigrants | Somalia | 15.8 /100 | #216 | Poor 14.1% |
| Immigrants | Trinidad and Tobago | 15.8 /100 | #217 | Poor 14.1% |
| French Canadians | 14.9 /100 | #218 | Poor 14.1% |
| Norwegians | 13.6 /100 | #219 | Poor 14.0% |
| Germans | 13.1 /100 | #220 | Poor 14.0% |
| Koreans | 12.7 /100 | #221 | Poor 14.0% |
| Ecuadorians | 12.6 /100 | #222 | Poor 14.0% |
| Immigrants | South Eastern Asia | 11.9 /100 | #223 | Poor 14.0% |
| Immigrants | Grenada | 11.8 /100 | #224 | Poor 14.0% |
| Portuguese | 11.2 /100 | #225 | Poor 13.9% |
| Immigrants | St. Vincent and the Grenadines | 11.0 /100 | #226 | Poor 13.9% |
| Immigrants | West Indies | 9.8 /100 | #227 | Tragic 13.9% |