Immigrants from England vs Ghanaian College, 1 year or more
COMPARE
Immigrants from England
Ghanaian
College, 1 year or more
College, 1 year or more Comparison
Immigrants from England
Ghanaians
62.8%
COLLEGE, 1 YEAR OR MORE
98.6/ 100
METRIC RATING
84th/ 347
METRIC RANK
58.4%
COLLEGE, 1 YEAR OR MORE
20.9/ 100
METRIC RATING
203rd/ 347
METRIC RANK
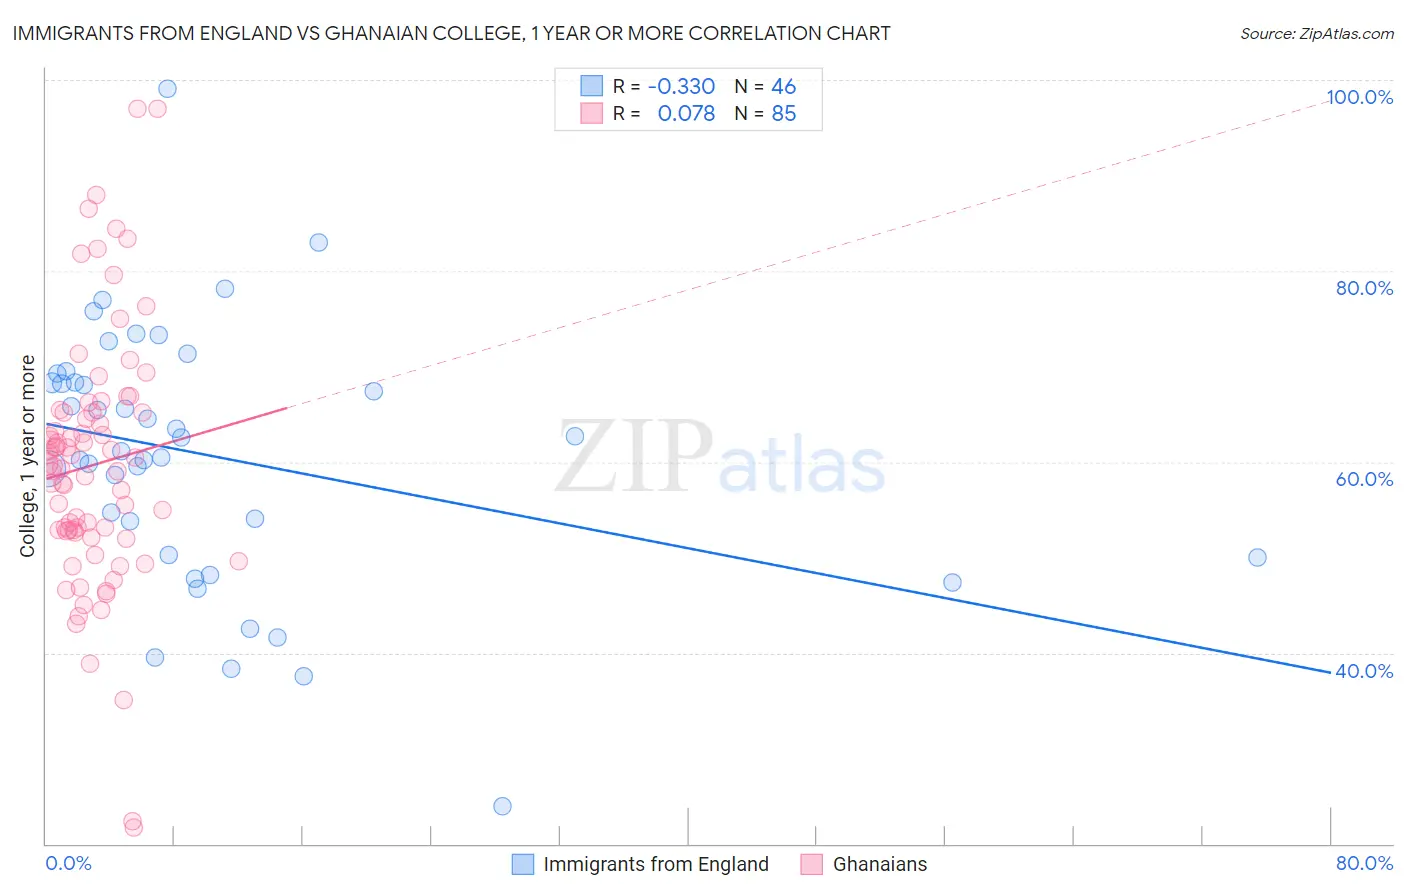
Immigrants from England vs Ghanaian College, 1 year or more Correlation Chart
The statistical analysis conducted on geographies consisting of 391,895,815 people shows a mild negative correlation between the proportion of Immigrants from England and percentage of population with at least college, 1 year or more education in the United States with a correlation coefficient (R) of -0.330 and weighted average of 62.8%. Similarly, the statistical analysis conducted on geographies consisting of 190,712,650 people shows a slight positive correlation between the proportion of Ghanaians and percentage of population with at least college, 1 year or more education in the United States with a correlation coefficient (R) of 0.078 and weighted average of 58.4%, a difference of 7.5%.
College, 1 year or more Correlation Summary
| Measurement | Immigrants from England | Ghanaian |
| Minimum | 23.9% | 21.7% |
| Maximum | 99.1% | 97.0% |
| Range | 75.3% | 75.4% |
| Mean | 60.6% | 59.7% |
| Median | 61.9% | 59.6% |
| Interquartile 25% (IQ1) | 50.3% | 52.7% |
| Interquartile 75% (IQ3) | 68.4% | 65.2% |
| Interquartile Range (IQR) | 18.1% | 12.5% |
| Standard Deviation (Sample) | 13.7% | 13.4% |
| Standard Deviation (Population) | 13.6% | 13.4% |
Similar Demographics by College, 1 year or more
Demographics Similar to Immigrants from England by College, 1 year or more
In terms of college, 1 year or more, the demographic groups most similar to Immigrants from England are Immigrants from Pakistan (62.8%, a difference of 0.010%), Immigrants from Argentina (62.8%, a difference of 0.030%), Immigrants from Western Europe (62.7%, a difference of 0.030%), Immigrants from Hungary (62.7%, a difference of 0.040%), and Immigrants from Bolivia (62.8%, a difference of 0.070%).
| Demographics | Rating | Rank | College, 1 year or more |
| Ethiopians | 98.8 /100 | #77 | Exceptional 62.9% |
| Immigrants | Lebanon | 98.8 /100 | #78 | Exceptional 62.9% |
| Northern Europeans | 98.8 /100 | #79 | Exceptional 62.9% |
| Lithuanians | 98.8 /100 | #80 | Exceptional 62.9% |
| Laotians | 98.7 /100 | #81 | Exceptional 62.8% |
| Immigrants | Bolivia | 98.7 /100 | #82 | Exceptional 62.8% |
| Immigrants | Argentina | 98.6 /100 | #83 | Exceptional 62.8% |
| Immigrants | England | 98.6 /100 | #84 | Exceptional 62.8% |
| Immigrants | Pakistan | 98.6 /100 | #85 | Exceptional 62.8% |
| Immigrants | Western Europe | 98.6 /100 | #86 | Exceptional 62.7% |
| Immigrants | Hungary | 98.6 /100 | #87 | Exceptional 62.7% |
| Greeks | 98.3 /100 | #88 | Exceptional 62.6% |
| Immigrants | Ethiopia | 98.2 /100 | #89 | Exceptional 62.6% |
| Immigrants | Western Asia | 97.9 /100 | #90 | Exceptional 62.5% |
| Immigrants | Eastern Europe | 97.8 /100 | #91 | Exceptional 62.4% |
Demographics Similar to Ghanaians by College, 1 year or more
In terms of college, 1 year or more, the demographic groups most similar to Ghanaians are Immigrants from South America (58.4%, a difference of 0.090%), Panamanian (58.3%, a difference of 0.14%), Nigerian (58.5%, a difference of 0.17%), Immigrants from Zaire (58.3%, a difference of 0.19%), and Immigrants from Vietnam (58.2%, a difference of 0.23%).
| Demographics | Rating | Rank | College, 1 year or more |
| Guamanians/Chamorros | 26.2 /100 | #196 | Fair 58.6% |
| Immigrants | Thailand | 26.0 /100 | #197 | Fair 58.6% |
| Immigrants | South Eastern Asia | 25.1 /100 | #198 | Fair 58.5% |
| Slovaks | 24.6 /100 | #199 | Fair 58.5% |
| Spanish | 24.2 /100 | #200 | Fair 58.5% |
| Nigerians | 23.0 /100 | #201 | Fair 58.5% |
| Immigrants | South America | 21.9 /100 | #202 | Fair 58.4% |
| Ghanaians | 20.9 /100 | #203 | Fair 58.4% |
| Panamanians | 19.2 /100 | #204 | Poor 58.3% |
| Immigrants | Zaire | 18.7 /100 | #205 | Poor 58.3% |
| Immigrants | Vietnam | 18.2 /100 | #206 | Poor 58.2% |
| Senegalese | 16.9 /100 | #207 | Poor 58.2% |
| Immigrants | Uruguay | 15.2 /100 | #208 | Poor 58.1% |
| Immigrants | Middle Africa | 14.0 /100 | #209 | Poor 58.0% |
| Tsimshian | 13.5 /100 | #210 | Poor 57.9% |