Comanche vs Immigrants from Turkey Associate's Degree
COMPARE
Comanche
Immigrants from Turkey
Associate's Degree
Associate's Degree Comparison
Comanche
Immigrants from Turkey
39.9%
ASSOCIATE'S DEGREE
0.1/ 100
METRIC RATING
284th/ 347
METRIC RANK
53.4%
ASSOCIATE'S DEGREE
100.0/ 100
METRIC RATING
32nd/ 347
METRIC RANK
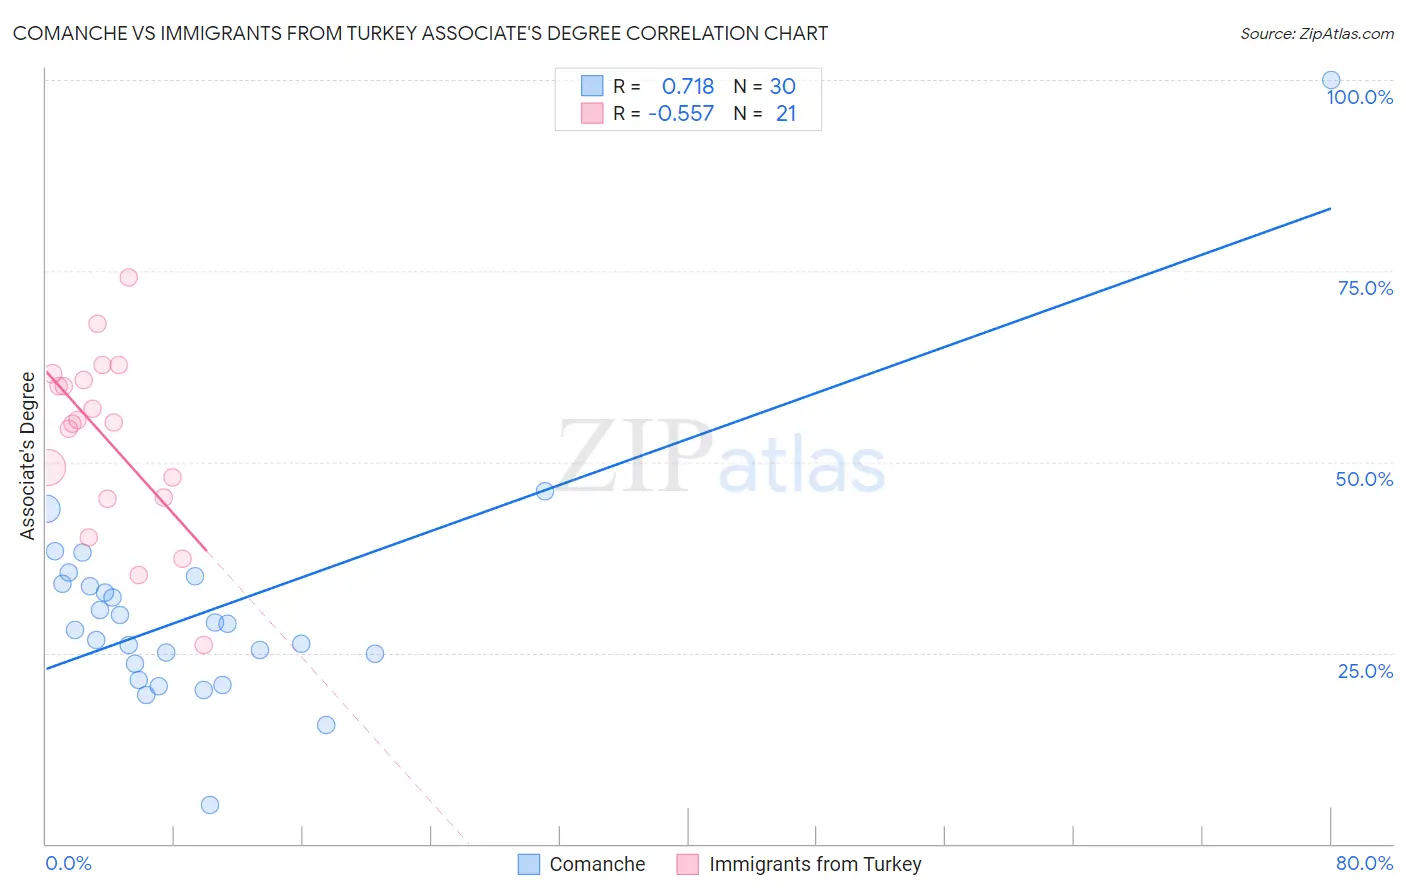
Comanche vs Immigrants from Turkey Associate's Degree Correlation Chart
The statistical analysis conducted on geographies consisting of 109,785,632 people shows a strong positive correlation between the proportion of Comanche and percentage of population with at least associate's degree education in the United States with a correlation coefficient (R) of 0.718 and weighted average of 39.9%. Similarly, the statistical analysis conducted on geographies consisting of 223,053,786 people shows a substantial negative correlation between the proportion of Immigrants from Turkey and percentage of population with at least associate's degree education in the United States with a correlation coefficient (R) of -0.557 and weighted average of 53.4%, a difference of 33.9%.
Associate's Degree Correlation Summary
| Measurement | Comanche | Immigrants from Turkey |
| Minimum | 5.1% | 26.0% |
| Maximum | 100.0% | 74.2% |
| Range | 94.9% | 48.2% |
| Mean | 30.6% | 53.0% |
| Median | 28.4% | 55.2% |
| Interquartile 25% (IQ1) | 23.5% | 45.2% |
| Interquartile 75% (IQ3) | 34.0% | 61.1% |
| Interquartile Range (IQR) | 10.5% | 15.9% |
| Standard Deviation (Sample) | 15.6% | 11.7% |
| Standard Deviation (Population) | 15.3% | 11.4% |
Similar Demographics by Associate's Degree
Demographics Similar to Comanche by Associate's Degree
In terms of associate's degree, the demographic groups most similar to Comanche are Immigrants from Belize (39.9%, a difference of 0.10%), Haitian (40.0%, a difference of 0.12%), Bangladeshi (40.0%, a difference of 0.26%), Immigrants from Caribbean (39.7%, a difference of 0.44%), and Immigrants from Portugal (40.1%, a difference of 0.58%).
| Demographics | Rating | Rank | Associate's Degree |
| Blackfeet | 0.1 /100 | #277 | Tragic 40.3% |
| Ottawa | 0.1 /100 | #278 | Tragic 40.3% |
| Immigrants | Nicaragua | 0.1 /100 | #279 | Tragic 40.3% |
| Immigrants | Micronesia | 0.1 /100 | #280 | Tragic 40.2% |
| Immigrants | Portugal | 0.1 /100 | #281 | Tragic 40.1% |
| Bangladeshis | 0.1 /100 | #282 | Tragic 40.0% |
| Haitians | 0.1 /100 | #283 | Tragic 40.0% |
| Comanche | 0.1 /100 | #284 | Tragic 39.9% |
| Immigrants | Belize | 0.1 /100 | #285 | Tragic 39.9% |
| Immigrants | Caribbean | 0.0 /100 | #286 | Tragic 39.7% |
| Aleuts | 0.0 /100 | #287 | Tragic 39.6% |
| Immigrants | Cuba | 0.0 /100 | #288 | Tragic 39.5% |
| Central Americans | 0.0 /100 | #289 | Tragic 39.4% |
| Immigrants | Haiti | 0.0 /100 | #290 | Tragic 39.3% |
| Dominicans | 0.0 /100 | #291 | Tragic 39.3% |
Demographics Similar to Immigrants from Turkey by Associate's Degree
In terms of associate's degree, the demographic groups most similar to Immigrants from Turkey are Immigrants from Northern Europe (53.5%, a difference of 0.030%), Israeli (53.4%, a difference of 0.12%), Bulgarian (53.3%, a difference of 0.31%), Russian (53.2%, a difference of 0.38%), and Immigrants from Sri Lanka (53.7%, a difference of 0.39%).
| Demographics | Rating | Rank | Associate's Degree |
| Immigrants | Switzerland | 100.0 /100 | #25 | Exceptional 54.5% |
| Immigrants | Belgium | 100.0 /100 | #26 | Exceptional 54.5% |
| Latvians | 100.0 /100 | #27 | Exceptional 53.9% |
| Turks | 100.0 /100 | #28 | Exceptional 53.9% |
| Immigrants | France | 100.0 /100 | #29 | Exceptional 53.9% |
| Immigrants | Sri Lanka | 100.0 /100 | #30 | Exceptional 53.7% |
| Immigrants | Northern Europe | 100.0 /100 | #31 | Exceptional 53.5% |
| Immigrants | Turkey | 100.0 /100 | #32 | Exceptional 53.4% |
| Israelis | 100.0 /100 | #33 | Exceptional 53.4% |
| Bulgarians | 100.0 /100 | #34 | Exceptional 53.3% |
| Russians | 100.0 /100 | #35 | Exceptional 53.2% |
| Immigrants | Russia | 100.0 /100 | #36 | Exceptional 53.1% |
| Immigrants | Denmark | 100.0 /100 | #37 | Exceptional 53.1% |
| Mongolians | 100.0 /100 | #38 | Exceptional 53.0% |
| Immigrants | Belarus | 99.9 /100 | #39 | Exceptional 52.8% |