Comanche vs Moroccan Associate's Degree
COMPARE
Comanche
Moroccan
Associate's Degree
Associate's Degree Comparison
Comanche
Moroccans
39.9%
ASSOCIATE'S DEGREE
0.1/ 100
METRIC RATING
284th/ 347
METRIC RANK
48.2%
ASSOCIATE'S DEGREE
89.3/ 100
METRIC RATING
134th/ 347
METRIC RANK
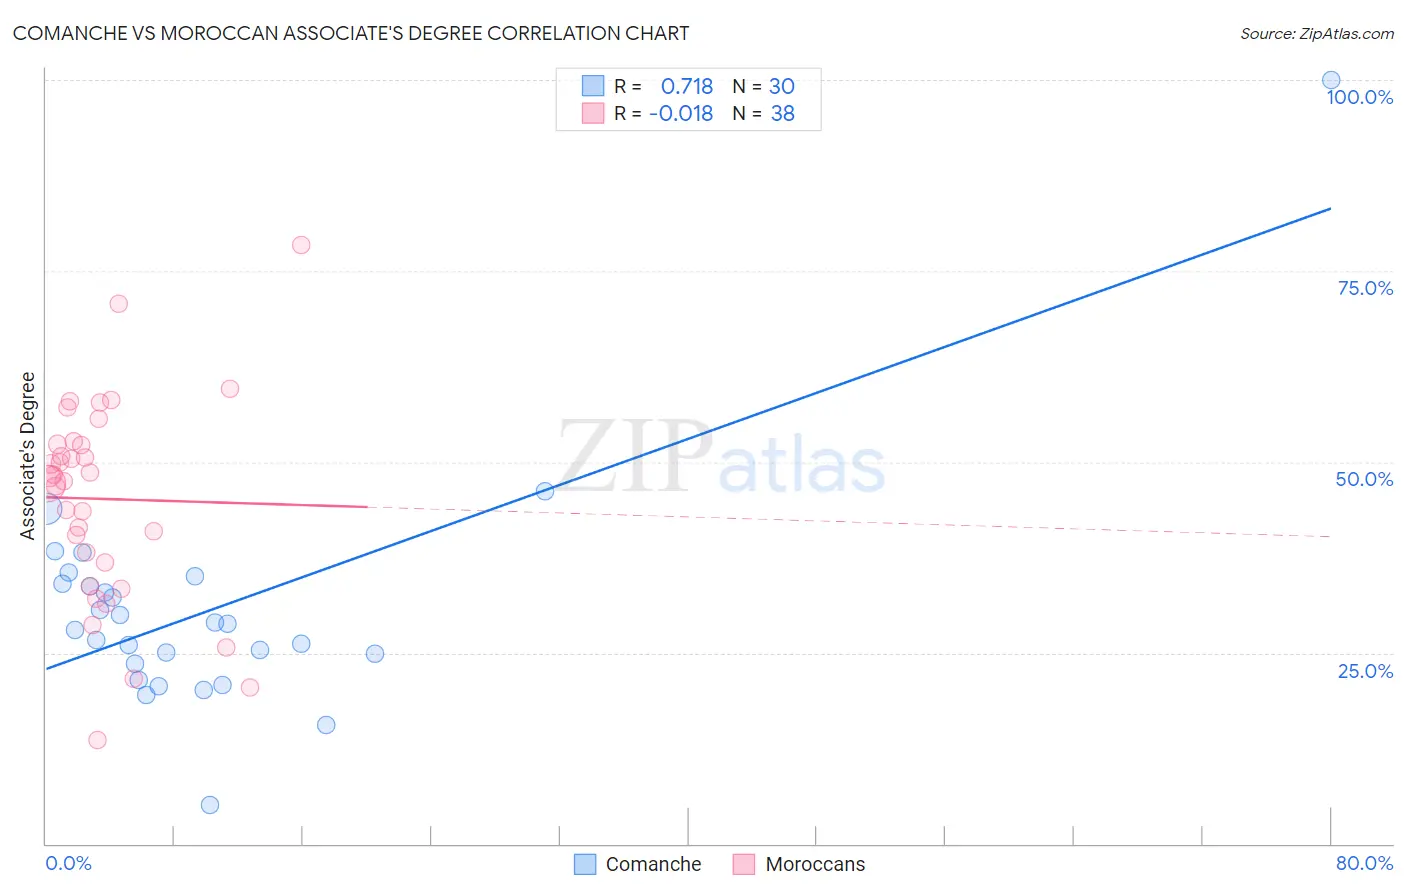
Comanche vs Moroccan Associate's Degree Correlation Chart
The statistical analysis conducted on geographies consisting of 109,785,632 people shows a strong positive correlation between the proportion of Comanche and percentage of population with at least associate's degree education in the United States with a correlation coefficient (R) of 0.718 and weighted average of 39.9%. Similarly, the statistical analysis conducted on geographies consisting of 201,815,061 people shows no correlation between the proportion of Moroccans and percentage of population with at least associate's degree education in the United States with a correlation coefficient (R) of -0.018 and weighted average of 48.2%, a difference of 20.7%.
Associate's Degree Correlation Summary
| Measurement | Comanche | Moroccan |
| Minimum | 5.1% | 13.6% |
| Maximum | 100.0% | 78.5% |
| Range | 94.9% | 64.9% |
| Mean | 30.6% | 45.2% |
| Median | 28.4% | 47.8% |
| Interquartile 25% (IQ1) | 23.5% | 36.9% |
| Interquartile 75% (IQ3) | 34.0% | 52.3% |
| Interquartile Range (IQR) | 10.5% | 15.4% |
| Standard Deviation (Sample) | 15.6% | 13.4% |
| Standard Deviation (Population) | 15.3% | 13.2% |
Similar Demographics by Associate's Degree
Demographics Similar to Comanche by Associate's Degree
In terms of associate's degree, the demographic groups most similar to Comanche are Immigrants from Belize (39.9%, a difference of 0.10%), Haitian (40.0%, a difference of 0.12%), Bangladeshi (40.0%, a difference of 0.26%), Immigrants from Caribbean (39.7%, a difference of 0.44%), and Immigrants from Portugal (40.1%, a difference of 0.58%).
| Demographics | Rating | Rank | Associate's Degree |
| Blackfeet | 0.1 /100 | #277 | Tragic 40.3% |
| Ottawa | 0.1 /100 | #278 | Tragic 40.3% |
| Immigrants | Nicaragua | 0.1 /100 | #279 | Tragic 40.3% |
| Immigrants | Micronesia | 0.1 /100 | #280 | Tragic 40.2% |
| Immigrants | Portugal | 0.1 /100 | #281 | Tragic 40.1% |
| Bangladeshis | 0.1 /100 | #282 | Tragic 40.0% |
| Haitians | 0.1 /100 | #283 | Tragic 40.0% |
| Comanche | 0.1 /100 | #284 | Tragic 39.9% |
| Immigrants | Belize | 0.1 /100 | #285 | Tragic 39.9% |
| Immigrants | Caribbean | 0.0 /100 | #286 | Tragic 39.7% |
| Aleuts | 0.0 /100 | #287 | Tragic 39.6% |
| Immigrants | Cuba | 0.0 /100 | #288 | Tragic 39.5% |
| Central Americans | 0.0 /100 | #289 | Tragic 39.4% |
| Immigrants | Haiti | 0.0 /100 | #290 | Tragic 39.3% |
| Dominicans | 0.0 /100 | #291 | Tragic 39.3% |
Demographics Similar to Moroccans by Associate's Degree
In terms of associate's degree, the demographic groups most similar to Moroccans are Assyrian/Chaldean/Syriac (48.2%, a difference of 0.020%), European (48.2%, a difference of 0.060%), Immigrants from Albania (48.2%, a difference of 0.10%), Pakistani (48.1%, a difference of 0.24%), and Immigrants from Eritrea (48.1%, a difference of 0.28%).
| Demographics | Rating | Rank | Associate's Degree |
| Immigrants | Uganda | 92.1 /100 | #127 | Exceptional 48.5% |
| Immigrants | Eastern Africa | 91.6 /100 | #128 | Exceptional 48.4% |
| Swedes | 91.5 /100 | #129 | Exceptional 48.4% |
| Immigrants | Jordan | 91.2 /100 | #130 | Exceptional 48.4% |
| Icelanders | 90.8 /100 | #131 | Exceptional 48.3% |
| Immigrants | Albania | 89.9 /100 | #132 | Excellent 48.2% |
| Assyrians/Chaldeans/Syriacs | 89.4 /100 | #133 | Excellent 48.2% |
| Moroccans | 89.3 /100 | #134 | Excellent 48.2% |
| Europeans | 89.0 /100 | #135 | Excellent 48.2% |
| Pakistanis | 88.0 /100 | #136 | Excellent 48.1% |
| Immigrants | Eritrea | 87.8 /100 | #137 | Excellent 48.1% |
| Poles | 87.3 /100 | #138 | Excellent 48.0% |
| Slovenes | 85.1 /100 | #139 | Excellent 47.9% |
| Immigrants | Southern Europe | 84.4 /100 | #140 | Excellent 47.8% |
| Taiwanese | 83.3 /100 | #141 | Excellent 47.7% |