Colombian vs Immigrants from Bahamas College, 1 year or more
COMPARE
Colombian
Immigrants from Bahamas
College, 1 year or more
College, 1 year or more Comparison
Colombians
Immigrants from Bahamas
58.7%
COLLEGE, 1 YEAR OR MORE
27.6/ 100
METRIC RATING
192nd/ 347
METRIC RANK
55.2%
COLLEGE, 1 YEAR OR MORE
0.5/ 100
METRIC RATING
255th/ 347
METRIC RANK
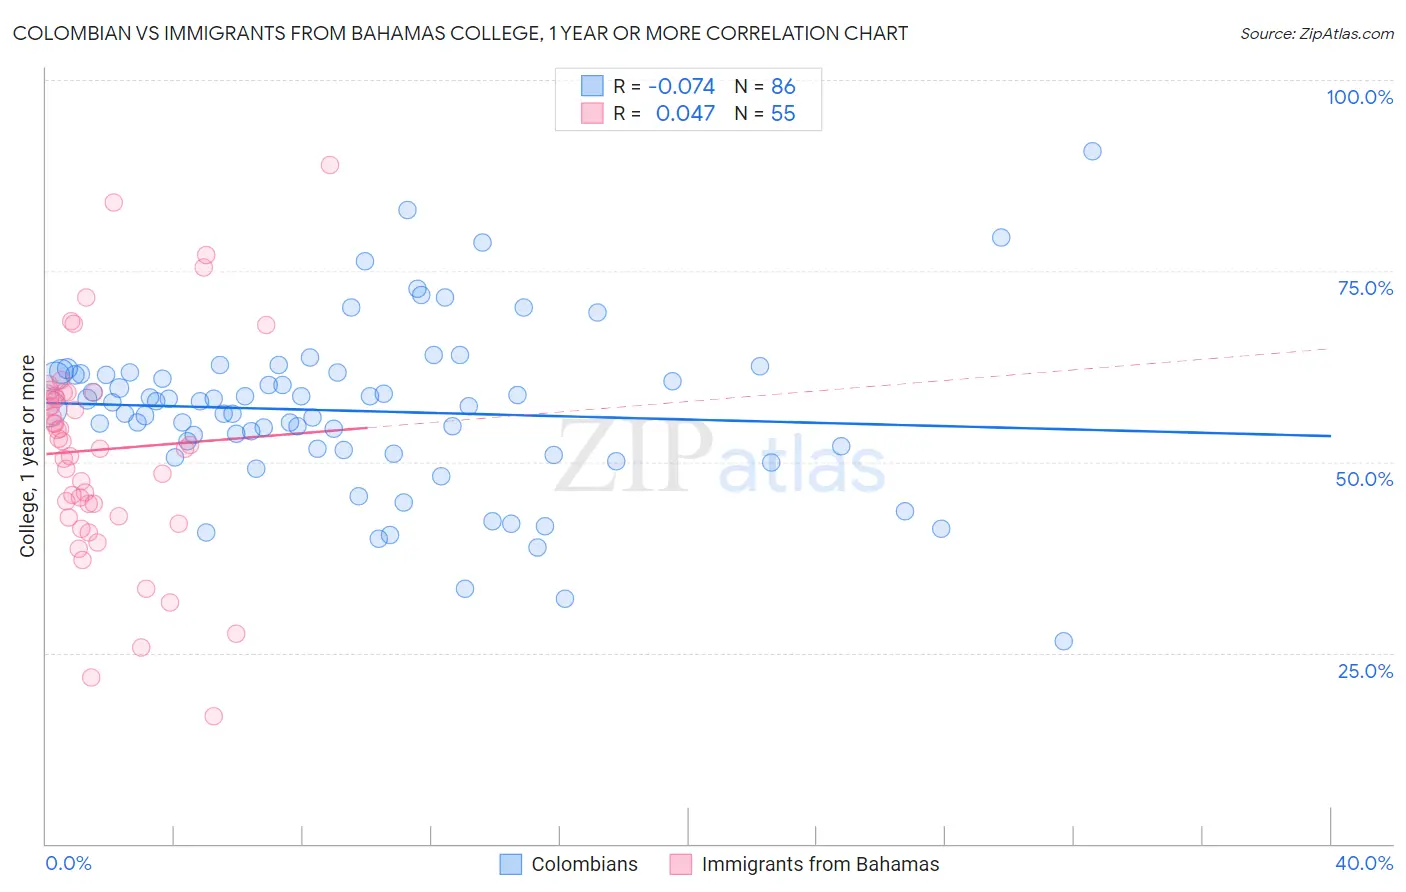
Colombian vs Immigrants from Bahamas College, 1 year or more Correlation Chart
The statistical analysis conducted on geographies consisting of 419,698,522 people shows a slight negative correlation between the proportion of Colombians and percentage of population with at least college, 1 year or more education in the United States with a correlation coefficient (R) of -0.074 and weighted average of 58.7%. Similarly, the statistical analysis conducted on geographies consisting of 104,668,341 people shows no correlation between the proportion of Immigrants from Bahamas and percentage of population with at least college, 1 year or more education in the United States with a correlation coefficient (R) of 0.047 and weighted average of 55.2%, a difference of 6.2%.
College, 1 year or more Correlation Summary
| Measurement | Colombian | Immigrants from Bahamas |
| Minimum | 26.5% | 16.6% |
| Maximum | 90.7% | 88.9% |
| Range | 64.2% | 72.2% |
| Mean | 56.7% | 51.6% |
| Median | 57.6% | 52.3% |
| Interquartile 25% (IQ1) | 51.5% | 42.8% |
| Interquartile 75% (IQ3) | 61.5% | 59.0% |
| Interquartile Range (IQR) | 10.0% | 16.2% |
| Standard Deviation (Sample) | 10.9% | 14.2% |
| Standard Deviation (Population) | 10.8% | 14.1% |
Similar Demographics by College, 1 year or more
Demographics Similar to Colombians by College, 1 year or more
In terms of college, 1 year or more, the demographic groups most similar to Colombians are Peruvian (58.6%, a difference of 0.010%), Costa Rican (58.6%, a difference of 0.080%), Immigrants from Philippines (58.7%, a difference of 0.10%), Dutch (58.6%, a difference of 0.10%), and Guamanian/Chamorro (58.6%, a difference of 0.10%).
| Demographics | Rating | Rank | College, 1 year or more |
| South Americans | 35.9 /100 | #185 | Fair 59.0% |
| Scotch-Irish | 34.7 /100 | #186 | Fair 58.9% |
| Germans | 34.7 /100 | #187 | Fair 58.9% |
| French | 34.4 /100 | #188 | Fair 58.9% |
| Uruguayans | 31.8 /100 | #189 | Fair 58.8% |
| Immigrants | Cameroon | 31.2 /100 | #190 | Fair 58.8% |
| Immigrants | Philippines | 29.2 /100 | #191 | Fair 58.7% |
| Colombians | 27.6 /100 | #192 | Fair 58.7% |
| Peruvians | 27.5 /100 | #193 | Fair 58.6% |
| Costa Ricans | 26.4 /100 | #194 | Fair 58.6% |
| Dutch | 26.2 /100 | #195 | Fair 58.6% |
| Guamanians/Chamorros | 26.2 /100 | #196 | Fair 58.6% |
| Immigrants | Thailand | 26.0 /100 | #197 | Fair 58.6% |
| Immigrants | South Eastern Asia | 25.1 /100 | #198 | Fair 58.5% |
| Slovaks | 24.6 /100 | #199 | Fair 58.5% |
Demographics Similar to Immigrants from Bahamas by College, 1 year or more
In terms of college, 1 year or more, the demographic groups most similar to Immigrants from Bahamas are Japanese (55.2%, a difference of 0.050%), Immigrants from West Indies (55.2%, a difference of 0.080%), Indonesian (55.1%, a difference of 0.17%), Immigrants from Barbados (55.4%, a difference of 0.30%), and Aleut (55.4%, a difference of 0.40%).
| Demographics | Rating | Rank | College, 1 year or more |
| Immigrants | Congo | 0.8 /100 | #248 | Tragic 55.6% |
| Immigrants | Trinidad and Tobago | 0.7 /100 | #249 | Tragic 55.5% |
| Delaware | 0.7 /100 | #250 | Tragic 55.5% |
| Immigrants | Cambodia | 0.6 /100 | #251 | Tragic 55.4% |
| Aleuts | 0.6 /100 | #252 | Tragic 55.4% |
| Immigrants | Barbados | 0.6 /100 | #253 | Tragic 55.4% |
| Japanese | 0.5 /100 | #254 | Tragic 55.2% |
| Immigrants | Bahamas | 0.5 /100 | #255 | Tragic 55.2% |
| Immigrants | West Indies | 0.5 /100 | #256 | Tragic 55.2% |
| Indonesians | 0.4 /100 | #257 | Tragic 55.1% |
| Africans | 0.4 /100 | #258 | Tragic 55.0% |
| Nepalese | 0.3 /100 | #259 | Tragic 54.9% |
| Jamaicans | 0.3 /100 | #260 | Tragic 54.9% |
| Ottawa | 0.3 /100 | #261 | Tragic 54.9% |
| Immigrants | St. Vincent and the Grenadines | 0.3 /100 | #262 | Tragic 54.8% |