Immigrants from China vs Immigrants from Bahamas College, 1 year or more
COMPARE
Immigrants from China
Immigrants from Bahamas
College, 1 year or more
College, 1 year or more Comparison
Immigrants from China
Immigrants from Bahamas
66.4%
COLLEGE, 1 YEAR OR MORE
100.0/ 100
METRIC RATING
23rd/ 347
METRIC RANK
55.2%
COLLEGE, 1 YEAR OR MORE
0.5/ 100
METRIC RATING
255th/ 347
METRIC RANK
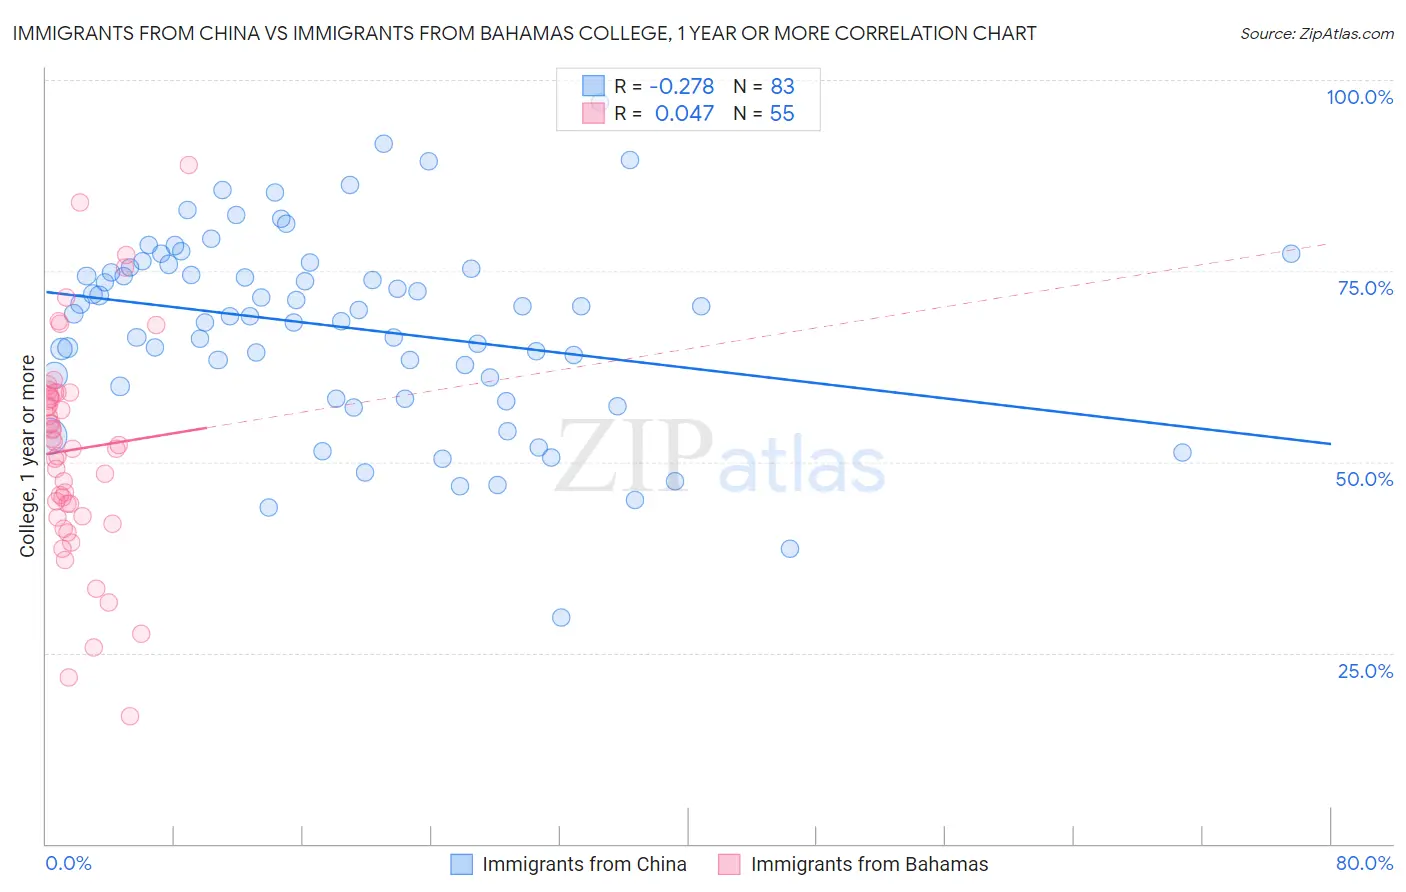
Immigrants from China vs Immigrants from Bahamas College, 1 year or more Correlation Chart
The statistical analysis conducted on geographies consisting of 457,078,071 people shows a weak negative correlation between the proportion of Immigrants from China and percentage of population with at least college, 1 year or more education in the United States with a correlation coefficient (R) of -0.278 and weighted average of 66.4%. Similarly, the statistical analysis conducted on geographies consisting of 104,668,341 people shows no correlation between the proportion of Immigrants from Bahamas and percentage of population with at least college, 1 year or more education in the United States with a correlation coefficient (R) of 0.047 and weighted average of 55.2%, a difference of 20.2%.
College, 1 year or more Correlation Summary
| Measurement | Immigrants from China | Immigrants from Bahamas |
| Minimum | 29.7% | 16.6% |
| Maximum | 97.0% | 88.9% |
| Range | 67.3% | 72.2% |
| Mean | 67.6% | 51.6% |
| Median | 69.5% | 52.3% |
| Interquartile 25% (IQ1) | 59.9% | 42.8% |
| Interquartile 75% (IQ3) | 75.5% | 59.0% |
| Interquartile Range (IQR) | 15.7% | 16.2% |
| Standard Deviation (Sample) | 12.7% | 14.2% |
| Standard Deviation (Population) | 12.6% | 14.1% |
Similar Demographics by College, 1 year or more
Demographics Similar to Immigrants from China by College, 1 year or more
In terms of college, 1 year or more, the demographic groups most similar to Immigrants from China are Soviet Union (66.4%, a difference of 0.060%), Immigrants from Belgium (66.3%, a difference of 0.080%), Immigrants from Hong Kong (66.4%, a difference of 0.12%), Immigrants from Korea (66.5%, a difference of 0.19%), and Immigrants from Switzerland (66.5%, a difference of 0.23%).
| Demographics | Rating | Rank | College, 1 year or more |
| Immigrants | Japan | 100.0 /100 | #16 | Exceptional 66.7% |
| Immigrants | Eastern Asia | 100.0 /100 | #17 | Exceptional 66.6% |
| Eastern Europeans | 100.0 /100 | #18 | Exceptional 66.6% |
| Immigrants | Switzerland | 100.0 /100 | #19 | Exceptional 66.5% |
| Immigrants | Korea | 100.0 /100 | #20 | Exceptional 66.5% |
| Immigrants | Hong Kong | 100.0 /100 | #21 | Exceptional 66.4% |
| Soviet Union | 100.0 /100 | #22 | Exceptional 66.4% |
| Immigrants | China | 100.0 /100 | #23 | Exceptional 66.4% |
| Immigrants | Belgium | 100.0 /100 | #24 | Exceptional 66.3% |
| Indians (Asian) | 100.0 /100 | #25 | Exceptional 66.1% |
| Latvians | 100.0 /100 | #26 | Exceptional 66.1% |
| Immigrants | Ireland | 100.0 /100 | #27 | Exceptional 65.9% |
| Immigrants | France | 100.0 /100 | #28 | Exceptional 65.8% |
| Immigrants | Northern Europe | 100.0 /100 | #29 | Exceptional 65.6% |
| Immigrants | Denmark | 100.0 /100 | #30 | Exceptional 65.6% |
Demographics Similar to Immigrants from Bahamas by College, 1 year or more
In terms of college, 1 year or more, the demographic groups most similar to Immigrants from Bahamas are Japanese (55.2%, a difference of 0.050%), Immigrants from West Indies (55.2%, a difference of 0.080%), Indonesian (55.1%, a difference of 0.17%), Immigrants from Barbados (55.4%, a difference of 0.30%), and Aleut (55.4%, a difference of 0.40%).
| Demographics | Rating | Rank | College, 1 year or more |
| Immigrants | Congo | 0.8 /100 | #248 | Tragic 55.6% |
| Immigrants | Trinidad and Tobago | 0.7 /100 | #249 | Tragic 55.5% |
| Delaware | 0.7 /100 | #250 | Tragic 55.5% |
| Immigrants | Cambodia | 0.6 /100 | #251 | Tragic 55.4% |
| Aleuts | 0.6 /100 | #252 | Tragic 55.4% |
| Immigrants | Barbados | 0.6 /100 | #253 | Tragic 55.4% |
| Japanese | 0.5 /100 | #254 | Tragic 55.2% |
| Immigrants | Bahamas | 0.5 /100 | #255 | Tragic 55.2% |
| Immigrants | West Indies | 0.5 /100 | #256 | Tragic 55.2% |
| Indonesians | 0.4 /100 | #257 | Tragic 55.1% |
| Africans | 0.4 /100 | #258 | Tragic 55.0% |
| Nepalese | 0.3 /100 | #259 | Tragic 54.9% |
| Jamaicans | 0.3 /100 | #260 | Tragic 54.9% |
| Ottawa | 0.3 /100 | #261 | Tragic 54.9% |
| Immigrants | St. Vincent and the Grenadines | 0.3 /100 | #262 | Tragic 54.8% |