Belgian vs Immigrants from Bahamas College, 1 year or more
COMPARE
Belgian
Immigrants from Bahamas
College, 1 year or more
College, 1 year or more Comparison
Belgians
Immigrants from Bahamas
59.7%
COLLEGE, 1 YEAR OR MORE
58.1/ 100
METRIC RATING
164th/ 347
METRIC RANK
55.2%
COLLEGE, 1 YEAR OR MORE
0.5/ 100
METRIC RATING
255th/ 347
METRIC RANK
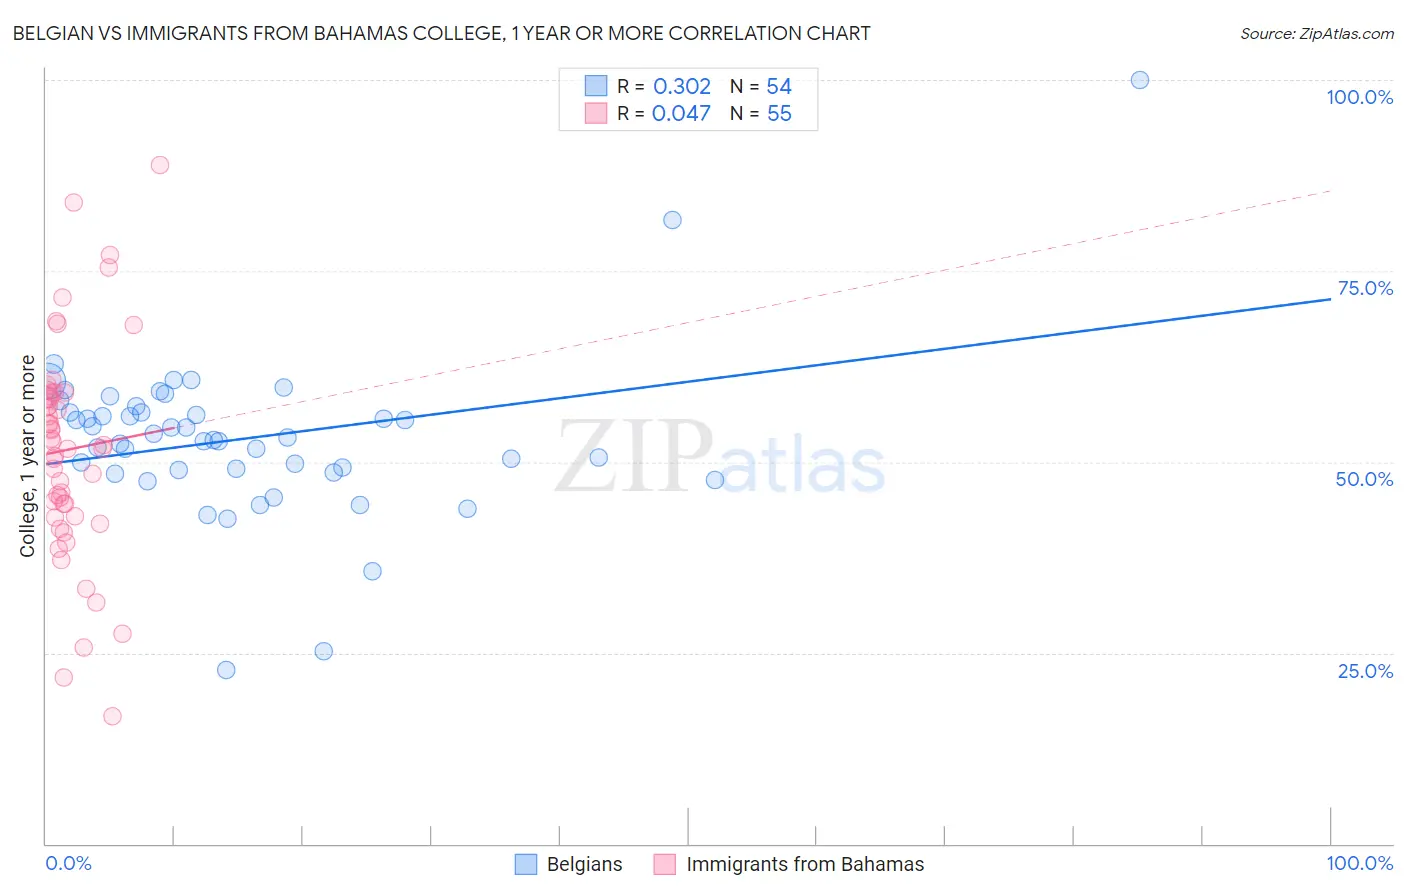
Belgian vs Immigrants from Bahamas College, 1 year or more Correlation Chart
The statistical analysis conducted on geographies consisting of 356,017,497 people shows a mild positive correlation between the proportion of Belgians and percentage of population with at least college, 1 year or more education in the United States with a correlation coefficient (R) of 0.302 and weighted average of 59.7%. Similarly, the statistical analysis conducted on geographies consisting of 104,668,341 people shows no correlation between the proportion of Immigrants from Bahamas and percentage of population with at least college, 1 year or more education in the United States with a correlation coefficient (R) of 0.047 and weighted average of 55.2%, a difference of 8.1%.
College, 1 year or more Correlation Summary
| Measurement | Belgian | Immigrants from Bahamas |
| Minimum | 22.8% | 16.6% |
| Maximum | 100.0% | 88.9% |
| Range | 77.2% | 72.2% |
| Mean | 53.1% | 51.6% |
| Median | 53.0% | 52.3% |
| Interquartile 25% (IQ1) | 48.9% | 42.8% |
| Interquartile 75% (IQ3) | 56.4% | 59.0% |
| Interquartile Range (IQR) | 7.6% | 16.2% |
| Standard Deviation (Sample) | 10.9% | 14.2% |
| Standard Deviation (Population) | 10.8% | 14.1% |
Similar Demographics by College, 1 year or more
Demographics Similar to Belgians by College, 1 year or more
In terms of college, 1 year or more, the demographic groups most similar to Belgians are Immigrants from Somalia (59.7%, a difference of 0.010%), Korean (59.7%, a difference of 0.020%), Irish (59.6%, a difference of 0.11%), Immigrants from Africa (59.6%, a difference of 0.11%), and Immigrants from North Macedonia (59.5%, a difference of 0.27%).
| Demographics | Rating | Rank | College, 1 year or more |
| Immigrants | Armenia | 68.8 /100 | #157 | Good 60.0% |
| English | 67.2 /100 | #158 | Good 60.0% |
| Immigrants | Iraq | 67.0 /100 | #159 | Good 60.0% |
| South American Indians | 66.9 /100 | #160 | Good 60.0% |
| Somalis | 64.5 /100 | #161 | Good 59.9% |
| Koreans | 58.5 /100 | #162 | Average 59.7% |
| Immigrants | Somalia | 58.3 /100 | #163 | Average 59.7% |
| Belgians | 58.1 /100 | #164 | Average 59.7% |
| Irish | 56.1 /100 | #165 | Average 59.6% |
| Immigrants | Africa | 56.1 /100 | #166 | Average 59.6% |
| Immigrants | North Macedonia | 53.1 /100 | #167 | Average 59.5% |
| Hungarians | 52.9 /100 | #168 | Average 59.5% |
| Immigrants | Southern Europe | 52.7 /100 | #169 | Average 59.5% |
| Welsh | 52.4 /100 | #170 | Average 59.5% |
| Immigrants | Albania | 52.3 /100 | #171 | Average 59.5% |
Demographics Similar to Immigrants from Bahamas by College, 1 year or more
In terms of college, 1 year or more, the demographic groups most similar to Immigrants from Bahamas are Japanese (55.2%, a difference of 0.050%), Immigrants from West Indies (55.2%, a difference of 0.080%), Indonesian (55.1%, a difference of 0.17%), Immigrants from Barbados (55.4%, a difference of 0.30%), and Aleut (55.4%, a difference of 0.40%).
| Demographics | Rating | Rank | College, 1 year or more |
| Immigrants | Congo | 0.8 /100 | #248 | Tragic 55.6% |
| Immigrants | Trinidad and Tobago | 0.7 /100 | #249 | Tragic 55.5% |
| Delaware | 0.7 /100 | #250 | Tragic 55.5% |
| Immigrants | Cambodia | 0.6 /100 | #251 | Tragic 55.4% |
| Aleuts | 0.6 /100 | #252 | Tragic 55.4% |
| Immigrants | Barbados | 0.6 /100 | #253 | Tragic 55.4% |
| Japanese | 0.5 /100 | #254 | Tragic 55.2% |
| Immigrants | Bahamas | 0.5 /100 | #255 | Tragic 55.2% |
| Immigrants | West Indies | 0.5 /100 | #256 | Tragic 55.2% |
| Indonesians | 0.4 /100 | #257 | Tragic 55.1% |
| Africans | 0.4 /100 | #258 | Tragic 55.0% |
| Nepalese | 0.3 /100 | #259 | Tragic 54.9% |
| Jamaicans | 0.3 /100 | #260 | Tragic 54.9% |
| Ottawa | 0.3 /100 | #261 | Tragic 54.9% |
| Immigrants | St. Vincent and the Grenadines | 0.3 /100 | #262 | Tragic 54.8% |