Colombian vs Immigrants from South Africa College, 1 year or more

COMPARE

Colombian
Race
Ancestry
AfghanAfricanAlaska NativeAlaskan AthabascanAlbanianAleutAlsatianAmericanApacheArabArapahoArgentineanArmenianAssyrian/Chaldean/SyriacAustralianAustrianBahamianBangladeshiBarbadianBasqueBelgianBelizeanBermudanBhutaneseBlackfeetBolivianBrazilianBritishBritish West IndianBulgarianBurmeseCajunCambodianCanadianCape VerdeanCarpatho RusynCelticCentral AmericanCentral American IndianCherokeeCheyenneChickasawChileanChineseChippewaChoctawColombianColvilleComancheCosta RicanCreeCreekCroatianCrowCubanCypriotCzechCzechoslovakianDanishDelawareDominicanDutchDutch West IndianEastern EuropeanEcuadorianEgyptianEnglishEstonianEthiopianEuropeanFijianFilipinoFinnishFrenchFrench American IndianFrench CanadianGermanGerman RussianGhanaianGreekGuamanian/ChamorroGuatemalanGuyaneseHaitianHmongHonduranHopiHoumaHungarianIcelanderIndian (Asian)IndonesianInupiatIranianIraqiIrishIroquoisIsraeliItalianJamaicanJapaneseJordanianKenyanKiowaKoreanLaotianLatvianLebaneseLiberianLithuanianLumbeeLuxembourgerMacedonianMalaysianMalteseMarshalleseMenomineeMexicanMexican American IndianMongolianMoroccanNative HawaiianNavajoNepaleseNew ZealanderNicaraguanNigerianNorthern EuropeanNorwegianOkinawanOsageOttawaPaiutePakistaniPalestinianPanamanianParaguayanPennsylvania GermanPeruvianPimaPolishPortuguesePotawatomiPuebloPuerto RicanPuget Sound SalishRomanianRussianSalvadoranSamoanScandinavianScotch-IrishScottishSeminoleSenegaleseSerbianShoshoneSierra LeoneanSiouxSlavicSlovakSloveneSomaliSouth AfricanSouth AmericanSouth American IndianSoviet UnionSpaniardSpanishSpanish AmericanSpanish American IndianSri LankanSubsaharan AfricanSudaneseSwedishSwissSyrianTaiwaneseThaiTlingit-HaidaTohono O'OdhamTonganTrinidadian and TobagonianTsimshianTurkishU.S. Virgin IslanderUgandanUkrainianUruguayanUteVenezuelanVietnameseWelshWest IndianYakamaYaquiYugoslavianYumanYup'ikZimbabwean
Immigration
NonimmigrantsImmigrantsAfghanistanAfricaAlbaniaArgentinaArmeniaAsiaAustraliaAustriaBahamasBangladeshBarbadosBelarusBelgiumBelizeBoliviaBosnia and HerzegovinaBrazilBulgariaBurma/MyanmarCabo VerdeCambodiaCameroonCanadaCaribbeanCentral AmericaChileChinaColombiaCongoCosta RicaCroatiaCubaCzechoslovakiaDenmarkDominicaDominican RepublicEastern AfricaEastern AsiaEastern EuropeEcuadorEgyptEl SalvadorEnglandEritreaEthiopiaEuropeFijiFranceGermanyGhanaGreeceGrenadaGuatemalaGuyanaHaitiHondurasHong KongHungaryIndiaIndonesiaIranIraqIrelandIsraelItalyJamaicaJapanJordanKazakhstanKenyaKoreaKuwaitLaosLatin AmericaLatviaLebanonLiberiaLithuaniaMalaysiaMexicoMicronesiaMiddle AfricaMoldovaMoroccoNepalNetherlandsNicaraguaNigeriaNorth AmericaNorth MacedoniaNorthern AfricaNorthern EuropeNorwayOceaniaPakistanPanamaPeruPhilippinesPolandPortugalRomaniaRussiaSaudi ArabiaScotlandSenegalSerbiaSierra LeoneSingaporeSomaliaSouth AmericaSouth Central AsiaSouth Eastern AsiaSouthern EuropeSpainSri LankaSt. Vincent and the GrenadinesSudanSwedenSwitzerlandSyriaTaiwanThailandTrinidad and TobagoTurkeyUgandaUkraineUruguayUzbekistanVenezuelaVietnamWest IndiesWestern AfricaWestern AsiaWestern EuropeYemenZaireZimbabweAzores
Immigrants from South Africa
Race
Ancestry
AfghanAfricanAlaska NativeAlaskan AthabascanAlbanianAleutAlsatianAmericanApacheArabArapahoArgentineanArmenianAssyrian/Chaldean/SyriacAustralianAustrianBahamianBangladeshiBarbadianBasqueBelgianBelizeanBermudanBhutaneseBlackfeetBolivianBrazilianBritishBritish West IndianBulgarianBurmeseCajunCambodianCanadianCape VerdeanCarpatho RusynCelticCentral AmericanCentral American IndianCherokeeCheyenneChickasawChileanChineseChippewaChoctawColvilleComancheCosta RicanCreeCreekCroatianCrowCubanCypriotCzechCzechoslovakianDanishDelawareDominicanDutchDutch West IndianEastern EuropeanEcuadorianEgyptianEnglishEstonianEthiopianEuropeanFijianFilipinoFinnishFrenchFrench American IndianFrench CanadianGermanGerman RussianGhanaianGreekGuamanian/ChamorroGuatemalanGuyaneseHaitianHmongHonduranHopiHoumaHungarianIcelanderIndian (Asian)IndonesianInupiatIranianIraqiIrishIroquoisIsraeliItalianJamaicanJapaneseJordanianKenyanKiowaKoreanLaotianLatvianLebaneseLiberianLithuanianLumbeeLuxembourgerMacedonianMalaysianMalteseMarshalleseMenomineeMexicanMexican American IndianMongolianMoroccanNative HawaiianNavajoNepaleseNew ZealanderNicaraguanNigerianNorthern EuropeanNorwegianOkinawanOsageOttawaPaiutePakistaniPalestinianPanamanianParaguayanPennsylvania GermanPeruvianPimaPolishPortuguesePotawatomiPuebloPuerto RicanPuget Sound SalishRomanianRussianSalvadoranSamoanScandinavianScotch-IrishScottishSeminoleSenegaleseSerbianShoshoneSierra LeoneanSiouxSlavicSlovakSloveneSomaliSouth AfricanSouth AmericanSouth American IndianSoviet UnionSpaniardSpanishSpanish AmericanSpanish American IndianSri LankanSubsaharan AfricanSudaneseSwedishSwissSyrianTaiwaneseThaiTlingit-HaidaTohono O'OdhamTonganTrinidadian and TobagonianTsimshianTurkishU.S. Virgin IslanderUgandanUkrainianUruguayanUteVenezuelanVietnameseWelshWest IndianYakamaYaquiYugoslavianYumanYup'ikZimbabwean
Immigration
NonimmigrantsImmigrantsAfghanistanAfricaAlbaniaArgentinaArmeniaAsiaAustraliaAustriaBahamasBangladeshBarbadosBelarusBelgiumBelizeBoliviaBosnia and HerzegovinaBrazilBulgariaBurma/MyanmarCabo VerdeCambodiaCameroonCanadaCaribbeanCentral AmericaChileChinaColombiaCongoCosta RicaCroatiaCubaCzechoslovakiaDenmarkDominicaDominican RepublicEastern AfricaEastern AsiaEastern EuropeEcuadorEgyptEl SalvadorEnglandEritreaEthiopiaEuropeFijiFranceGermanyGhanaGreeceGrenadaGuatemalaGuyanaHaitiHondurasHong KongHungaryIndiaIndonesiaIranIraqIrelandIsraelItalyJamaicaJapanJordanKazakhstanKenyaKoreaKuwaitLaosLatin AmericaLatviaLebanonLiberiaLithuaniaMalaysiaMexicoMicronesiaMiddle AfricaMoldovaMoroccoNepalNetherlandsNicaraguaNigeriaNorth AmericaNorth MacedoniaNorthern AfricaNorthern EuropeNorwayOceaniaPakistanPanamaPeruPhilippinesPolandPortugalRomaniaRussiaSaudi ArabiaScotlandSenegalSerbiaSierra LeoneSingaporeSomaliaSouth AfricaSouth AmericaSouth Central AsiaSouth Eastern AsiaSouthern EuropeSpainSri LankaSt. Vincent and the GrenadinesSudanSwedenSwitzerlandSyriaTaiwanThailandTrinidad and TobagoTurkeyUgandaUkraineUruguayUzbekistanVenezuelaVietnamWest IndiesWestern AfricaWestern AsiaWestern EuropeYemenZaireZimbabweAzores
College, 1 year or more
Income
Poverty
Unemployment
Labor Participation
Family Structure
Vehicle Availability
Education Level
Disability

College, 1 year or more Comparison

Colombians

Immigrants from South Africa

Fair
Exceptional
58.7%
COLLEGE, 1 YEAR OR MORE
27.6/ 100
METRIC RATING
192nd/ 347
METRIC RANK
65.1%
COLLEGE, 1 YEAR OR MORE
99.9/ 100
METRIC RATING
36th/ 347
METRIC RANK

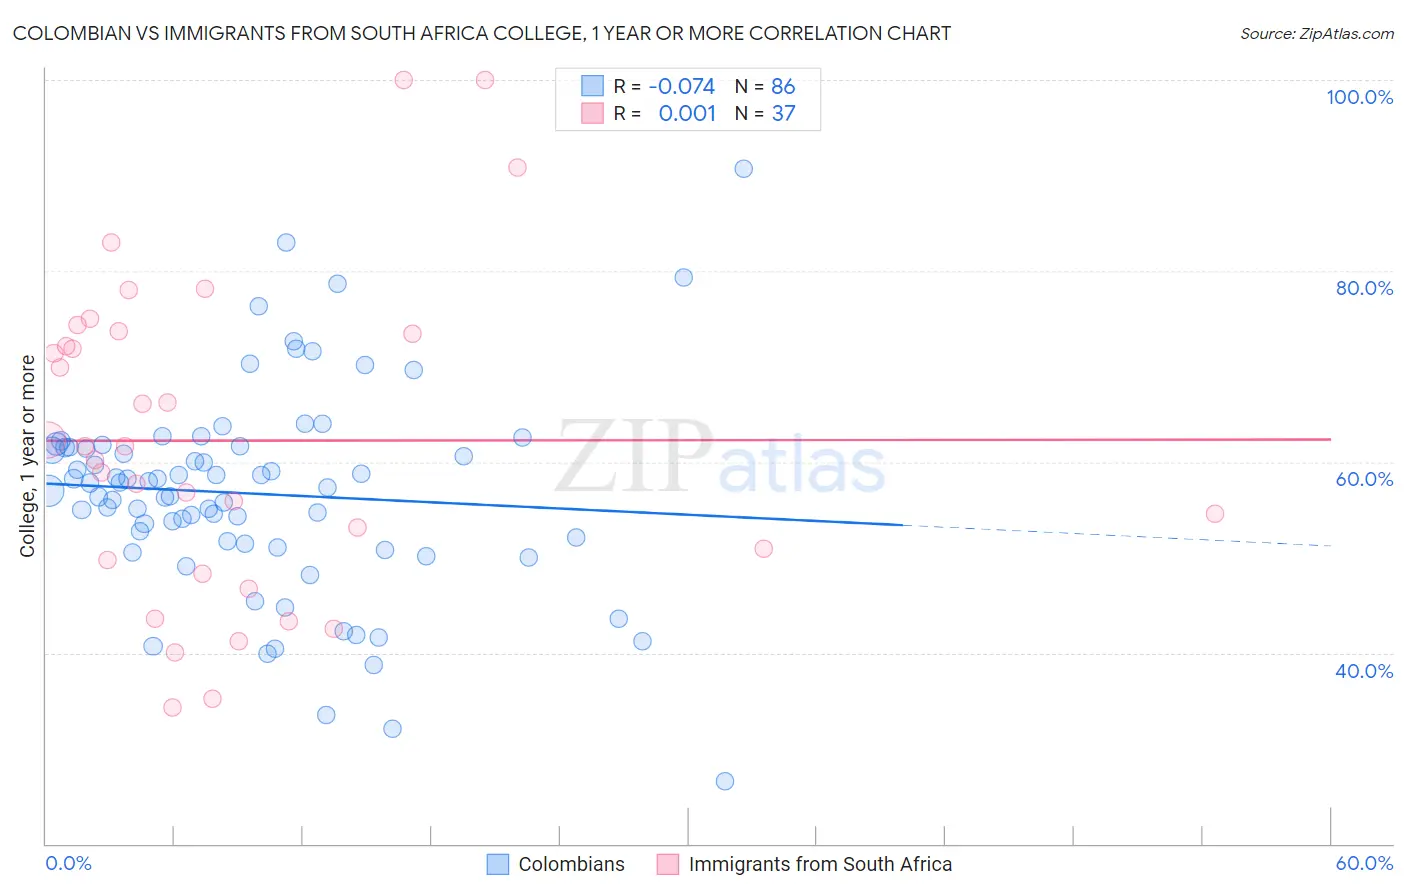
Colombian vs Immigrants from South Africa College, 1 year or more Correlation Chart

The statistical analysis conducted on geographies consisting of 419,698,522 people shows a slight negative correlation between the proportion of Colombians and percentage of population with at least college, 1 year or more education in the United States with a correlation coefficient (R) of -0.074 and weighted average of 58.7%. Similarly, the statistical analysis conducted on geographies consisting of 233,321,300 people shows no correlation between the proportion of Immigrants from South Africa and percentage of population with at least college, 1 year or more education in the United States with a correlation coefficient (R) of 0.001 and weighted average of 65.1%, a difference of 11.1%.
Colombian vs Immigrants from South Africa College, 1 year or more

College, 1 year or more Correlation Summary

MeasurementColombianImmigrants from South Africa
Minimum26.5%34.2%
Maximum90.7%100.0%
Range64.2%65.8%
Mean56.7%62.2%
Median57.6%61.6%
Interquartile 25% (IQ1)51.5%49.0%
Interquartile 75% (IQ3)61.5%73.6%
Interquartile Range (IQR)10.0%24.6%
Standard Deviation (Sample)10.9%16.7%
Standard Deviation (Population)10.8%16.5%

Similar Demographics by College, 1 year or more

Demographics Similar to Colombians by College, 1 year or more

In terms of college, 1 year or more, the demographic groups most similar to Colombians are Peruvian (58.6%, a difference of 0.010%), Costa Rican (58.6%, a difference of 0.080%), Immigrants from Philippines (58.7%, a difference of 0.10%), Dutch (58.6%, a difference of 0.10%), and Guamanian/Chamorro (58.6%, a difference of 0.10%).
DemographicsRating | RankCollege, 1 year or more
South Americans
35.9
/100
|
#185
Fair
59.0%
Scotch-Irish
34.7
/100
|
#186
Fair
58.9%
Germans
34.7
/100
|
#187
Fair
58.9%
French
34.4
/100
|
#188
Fair
58.9%
Uruguayans
31.8
/100
|
#189
Fair
58.8%
Immigrants | Cameroon
31.2
/100
|
#190
Fair
58.8%
Immigrants | Philippines
29.2
/100
|
#191
Fair
58.7%
Colombians
27.6
/100
|
#192
Fair
58.7%
Peruvians
27.5
/100
|
#193
Fair
58.6%
Costa Ricans
26.4
/100
|
#194
Fair
58.6%
Dutch
26.2
/100
|
#195
Fair
58.6%
Guamanians/Chamorros
26.2
/100
|
#196
Fair
58.6%
Immigrants | Thailand
26.0
/100
|
#197
Fair
58.6%
Immigrants | South Eastern Asia
25.1
/100
|
#198
Fair
58.5%
Slovaks
24.6
/100
|
#199
Fair
58.5%

Demographics Similar to Immigrants from South Africa by College, 1 year or more

In terms of college, 1 year or more, the demographic groups most similar to Immigrants from South Africa are Russian (65.1%, a difference of 0.010%), Immigrants from Turkey (65.2%, a difference of 0.080%), Immigrants from Saudi Arabia (65.0%, a difference of 0.15%), Estonian (65.0%, a difference of 0.23%), and Israeli (65.3%, a difference of 0.28%).
DemographicsRating | RankCollege, 1 year or more
Immigrants | Northern Europe
100.0
/100
|
#29
Exceptional
65.6%
Immigrants | Denmark
100.0
/100
|
#30
Exceptional
65.6%
Turks
100.0
/100
|
#31
Exceptional
65.5%
Bulgarians
100.0
/100
|
#32
Exceptional
65.5%
Immigrants | Sri Lanka
99.9
/100
|
#33
Exceptional
65.4%
Israelis
99.9
/100
|
#34
Exceptional
65.3%
Immigrants | Turkey
99.9
/100
|
#35
Exceptional
65.2%
Immigrants | South Africa
99.9
/100
|
#36
Exceptional
65.1%
Russians
99.9
/100
|
#37
Exceptional
65.1%
Immigrants | Saudi Arabia
99.9
/100
|
#38
Exceptional
65.0%
Estonians
99.9
/100
|
#39
Exceptional
65.0%
Immigrants | Kuwait
99.9
/100
|
#40
Exceptional
65.0%
Mongolians
99.9
/100
|
#41
Exceptional
64.8%
Immigrants | Latvia
99.9
/100
|
#42
Exceptional
64.8%
Immigrants | Russia
99.9
/100
|
#43
Exceptional
64.7%