Belizean vs Immigrants from Bahamas College, 1 year or more
COMPARE
Belizean
Immigrants from Bahamas
College, 1 year or more
College, 1 year or more Comparison
Belizeans
Immigrants from Bahamas
54.4%
COLLEGE, 1 YEAR OR MORE
0.2/ 100
METRIC RATING
274th/ 347
METRIC RANK
55.2%
COLLEGE, 1 YEAR OR MORE
0.5/ 100
METRIC RATING
255th/ 347
METRIC RANK
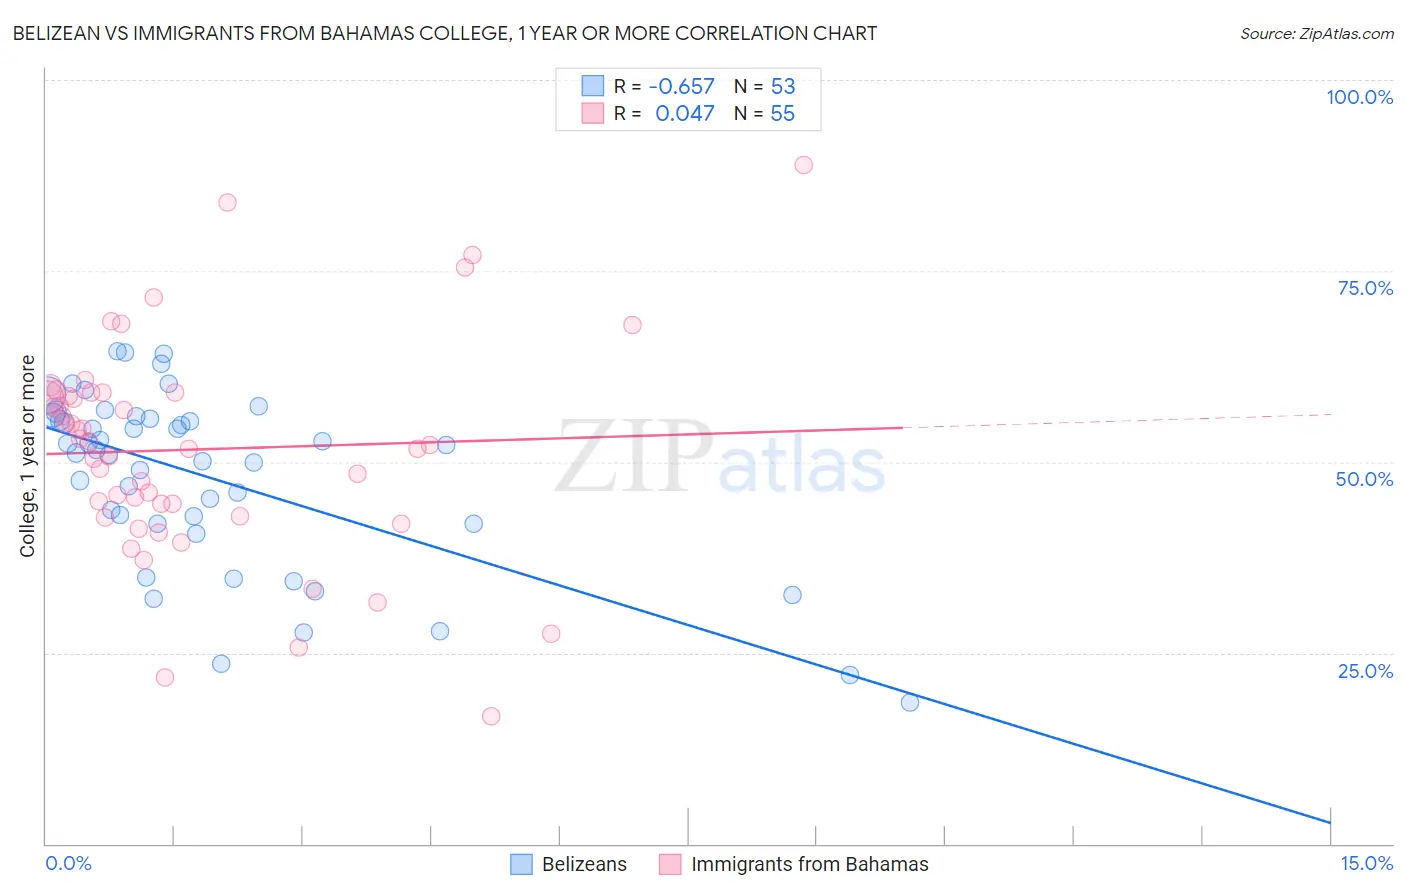
Belizean vs Immigrants from Bahamas College, 1 year or more Correlation Chart
The statistical analysis conducted on geographies consisting of 144,224,111 people shows a significant negative correlation between the proportion of Belizeans and percentage of population with at least college, 1 year or more education in the United States with a correlation coefficient (R) of -0.657 and weighted average of 54.4%. Similarly, the statistical analysis conducted on geographies consisting of 104,668,341 people shows no correlation between the proportion of Immigrants from Bahamas and percentage of population with at least college, 1 year or more education in the United States with a correlation coefficient (R) of 0.047 and weighted average of 55.2%, a difference of 1.5%.
College, 1 year or more Correlation Summary
| Measurement | Belizean | Immigrants from Bahamas |
| Minimum | 18.5% | 16.6% |
| Maximum | 64.4% | 88.9% |
| Range | 45.9% | 72.2% |
| Mean | 48.0% | 51.6% |
| Median | 51.6% | 52.3% |
| Interquartile 25% (IQ1) | 41.8% | 42.8% |
| Interquartile 75% (IQ3) | 55.8% | 59.0% |
| Interquartile Range (IQR) | 14.0% | 16.2% |
| Standard Deviation (Sample) | 11.5% | 14.2% |
| Standard Deviation (Population) | 11.4% | 14.1% |
Demographics Similar to Belizeans and Immigrants from Bahamas by College, 1 year or more
In terms of college, 1 year or more, the demographic groups most similar to Belizeans are Immigrants from Grenada (54.4%, a difference of 0.040%), Comanche (54.4%, a difference of 0.080%), Bahamian (54.5%, a difference of 0.12%), Crow (54.5%, a difference of 0.15%), and Bangladeshi (54.5%, a difference of 0.18%). Similarly, the demographic groups most similar to Immigrants from Bahamas are Japanese (55.2%, a difference of 0.050%), Immigrants from West Indies (55.2%, a difference of 0.080%), Indonesian (55.1%, a difference of 0.17%), African (55.0%, a difference of 0.46%), and Nepalese (54.9%, a difference of 0.52%).
| Demographics | Rating | Rank | College, 1 year or more |
| Japanese | 0.5 /100 | #254 | Tragic 55.2% |
| Immigrants | Bahamas | 0.5 /100 | #255 | Tragic 55.2% |
| Immigrants | West Indies | 0.5 /100 | #256 | Tragic 55.2% |
| Indonesians | 0.4 /100 | #257 | Tragic 55.1% |
| Africans | 0.4 /100 | #258 | Tragic 55.0% |
| Nepalese | 0.3 /100 | #259 | Tragic 54.9% |
| Jamaicans | 0.3 /100 | #260 | Tragic 54.9% |
| Ottawa | 0.3 /100 | #261 | Tragic 54.9% |
| Immigrants | St. Vincent and the Grenadines | 0.3 /100 | #262 | Tragic 54.8% |
| U.S. Virgin Islanders | 0.3 /100 | #263 | Tragic 54.8% |
| Immigrants | Micronesia | 0.3 /100 | #264 | Tragic 54.8% |
| Immigrants | Laos | 0.2 /100 | #265 | Tragic 54.7% |
| Potawatomi | 0.2 /100 | #266 | Tragic 54.6% |
| Blackfeet | 0.2 /100 | #267 | Tragic 54.6% |
| British West Indians | 0.2 /100 | #268 | Tragic 54.5% |
| Bangladeshis | 0.2 /100 | #269 | Tragic 54.5% |
| Crow | 0.2 /100 | #270 | Tragic 54.5% |
| Bahamians | 0.2 /100 | #271 | Tragic 54.5% |
| Comanche | 0.2 /100 | #272 | Tragic 54.4% |
| Immigrants | Grenada | 0.2 /100 | #273 | Tragic 54.4% |
| Belizeans | 0.2 /100 | #274 | Tragic 54.4% |