Colombian vs Danish College, 1 year or more
COMPARE
Colombian
Danish
College, 1 year or more
College, 1 year or more Comparison
Colombians
Danes
58.7%
COLLEGE, 1 YEAR OR MORE
27.6/ 100
METRIC RATING
192nd/ 347
METRIC RANK
61.7%
COLLEGE, 1 YEAR OR MORE
94.8/ 100
METRIC RATING
114th/ 347
METRIC RANK
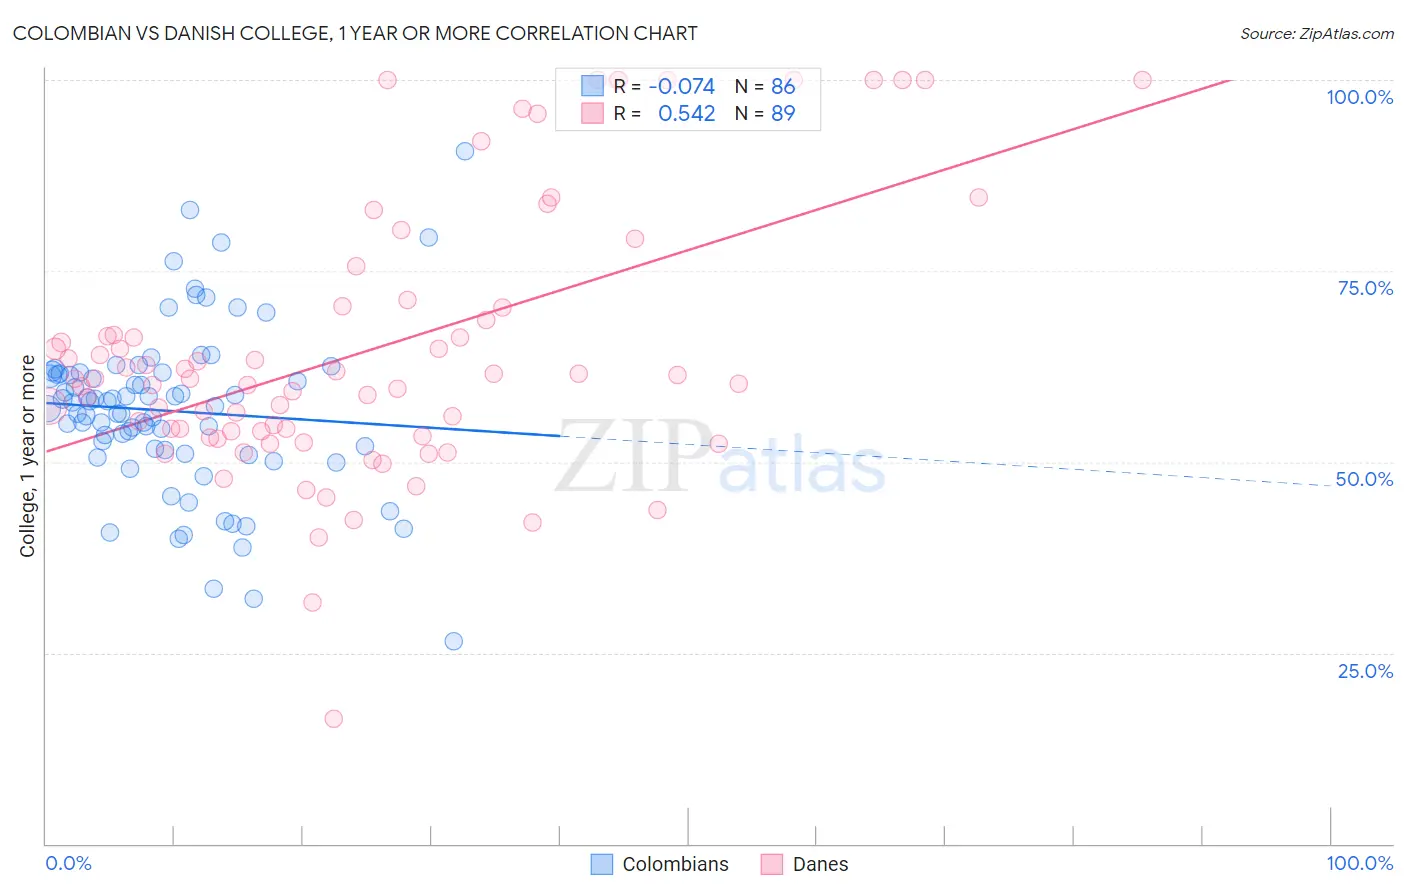
Colombian vs Danish College, 1 year or more Correlation Chart
The statistical analysis conducted on geographies consisting of 419,698,522 people shows a slight negative correlation between the proportion of Colombians and percentage of population with at least college, 1 year or more education in the United States with a correlation coefficient (R) of -0.074 and weighted average of 58.7%. Similarly, the statistical analysis conducted on geographies consisting of 474,193,590 people shows a substantial positive correlation between the proportion of Danes and percentage of population with at least college, 1 year or more education in the United States with a correlation coefficient (R) of 0.542 and weighted average of 61.7%, a difference of 5.2%.
College, 1 year or more Correlation Summary
| Measurement | Colombian | Danish |
| Minimum | 26.5% | 16.4% |
| Maximum | 90.7% | 100.0% |
| Range | 64.2% | 83.6% |
| Mean | 56.7% | 64.6% |
| Median | 57.6% | 60.9% |
| Interquartile 25% (IQ1) | 51.5% | 53.6% |
| Interquartile 75% (IQ3) | 61.5% | 70.3% |
| Interquartile Range (IQR) | 10.0% | 16.7% |
| Standard Deviation (Sample) | 10.9% | 17.7% |
| Standard Deviation (Population) | 10.8% | 17.6% |
Similar Demographics by College, 1 year or more
Demographics Similar to Colombians by College, 1 year or more
In terms of college, 1 year or more, the demographic groups most similar to Colombians are Peruvian (58.6%, a difference of 0.010%), Costa Rican (58.6%, a difference of 0.080%), Immigrants from Philippines (58.7%, a difference of 0.10%), Dutch (58.6%, a difference of 0.10%), and Guamanian/Chamorro (58.6%, a difference of 0.10%).
| Demographics | Rating | Rank | College, 1 year or more |
| South Americans | 35.9 /100 | #185 | Fair 59.0% |
| Scotch-Irish | 34.7 /100 | #186 | Fair 58.9% |
| Germans | 34.7 /100 | #187 | Fair 58.9% |
| French | 34.4 /100 | #188 | Fair 58.9% |
| Uruguayans | 31.8 /100 | #189 | Fair 58.8% |
| Immigrants | Cameroon | 31.2 /100 | #190 | Fair 58.8% |
| Immigrants | Philippines | 29.2 /100 | #191 | Fair 58.7% |
| Colombians | 27.6 /100 | #192 | Fair 58.7% |
| Peruvians | 27.5 /100 | #193 | Fair 58.6% |
| Costa Ricans | 26.4 /100 | #194 | Fair 58.6% |
| Dutch | 26.2 /100 | #195 | Fair 58.6% |
| Guamanians/Chamorros | 26.2 /100 | #196 | Fair 58.6% |
| Immigrants | Thailand | 26.0 /100 | #197 | Fair 58.6% |
| Immigrants | South Eastern Asia | 25.1 /100 | #198 | Fair 58.5% |
| Slovaks | 24.6 /100 | #199 | Fair 58.5% |
Demographics Similar to Danes by College, 1 year or more
In terms of college, 1 year or more, the demographic groups most similar to Danes are Norwegian (61.7%, a difference of 0.070%), Ukrainian (61.8%, a difference of 0.11%), Lebanese (61.6%, a difference of 0.17%), Austrian (61.8%, a difference of 0.18%), and Arab (61.6%, a difference of 0.21%).
| Demographics | Rating | Rank | College, 1 year or more |
| Immigrants | Ukraine | 95.8 /100 | #107 | Exceptional 61.9% |
| Syrians | 95.7 /100 | #108 | Exceptional 61.9% |
| Immigrants | Northern Africa | 95.7 /100 | #109 | Exceptional 61.9% |
| Europeans | 95.6 /100 | #110 | Exceptional 61.8% |
| Macedonians | 95.6 /100 | #111 | Exceptional 61.8% |
| Austrians | 95.4 /100 | #112 | Exceptional 61.8% |
| Ukrainians | 95.2 /100 | #113 | Exceptional 61.8% |
| Danes | 94.8 /100 | #114 | Exceptional 61.7% |
| Norwegians | 94.5 /100 | #115 | Exceptional 61.7% |
| Lebanese | 94.1 /100 | #116 | Exceptional 61.6% |
| Arabs | 93.9 /100 | #117 | Exceptional 61.6% |
| Immigrants | Brazil | 93.9 /100 | #118 | Exceptional 61.6% |
| Assyrians/Chaldeans/Syriacs | 93.3 /100 | #119 | Exceptional 61.5% |
| Pakistanis | 93.2 /100 | #120 | Exceptional 61.5% |
| Immigrants | Jordan | 92.7 /100 | #121 | Exceptional 61.4% |