Colombian vs New Zealander College, 1 year or more
COMPARE
Colombian
New Zealander
College, 1 year or more
College, 1 year or more Comparison
Colombians
New Zealanders
58.7%
COLLEGE, 1 YEAR OR MORE
27.6/ 100
METRIC RATING
192nd/ 347
METRIC RANK
64.6%
COLLEGE, 1 YEAR OR MORE
99.9/ 100
METRIC RATING
49th/ 347
METRIC RANK
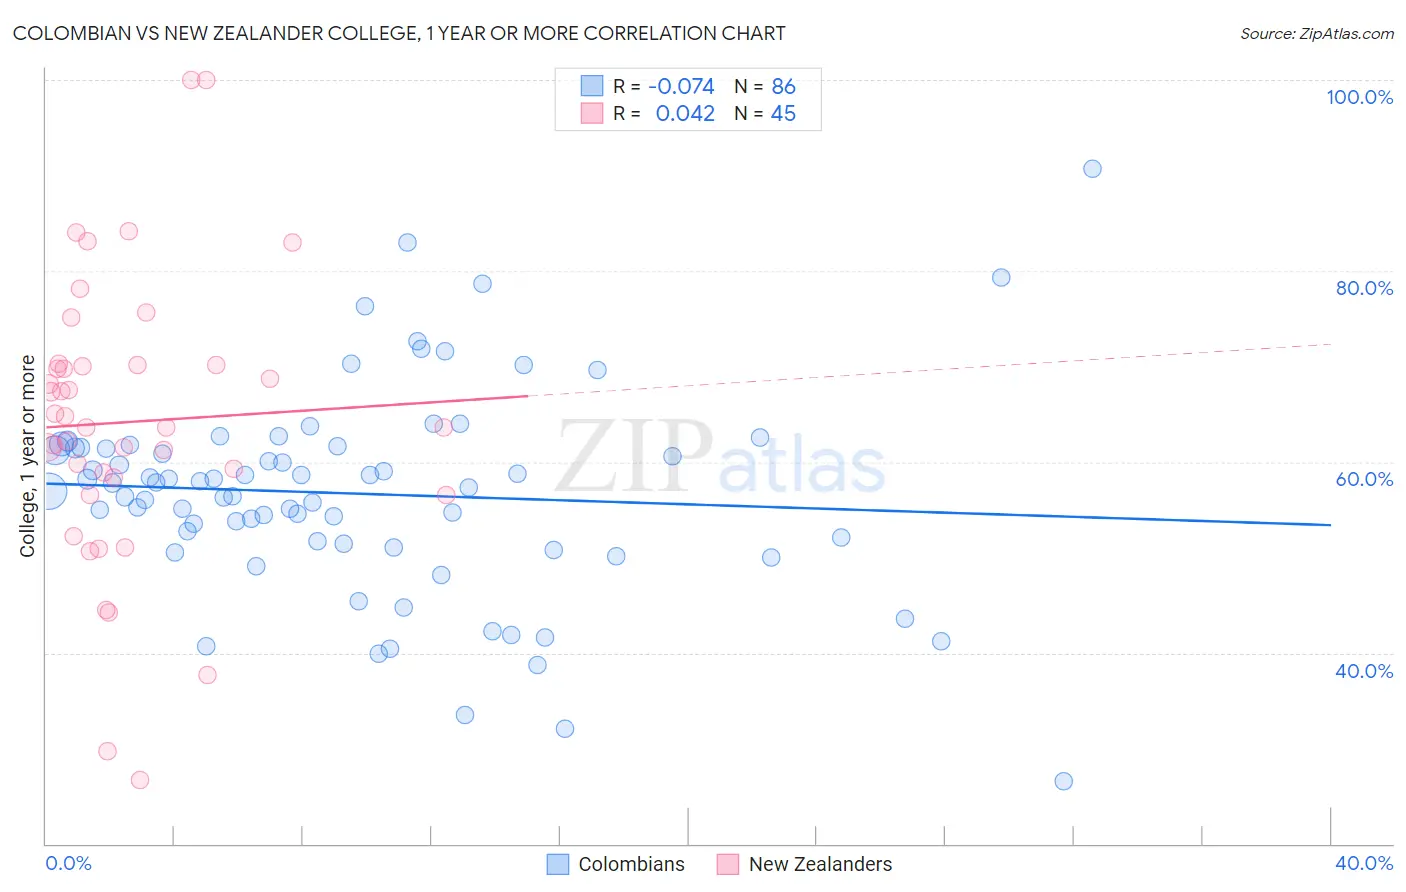
Colombian vs New Zealander College, 1 year or more Correlation Chart
The statistical analysis conducted on geographies consisting of 419,698,522 people shows a slight negative correlation between the proportion of Colombians and percentage of population with at least college, 1 year or more education in the United States with a correlation coefficient (R) of -0.074 and weighted average of 58.7%. Similarly, the statistical analysis conducted on geographies consisting of 106,918,889 people shows no correlation between the proportion of New Zealanders and percentage of population with at least college, 1 year or more education in the United States with a correlation coefficient (R) of 0.042 and weighted average of 64.6%, a difference of 10.1%.
College, 1 year or more Correlation Summary
| Measurement | Colombian | New Zealander |
| Minimum | 26.5% | 26.7% |
| Maximum | 90.7% | 100.0% |
| Range | 64.2% | 73.3% |
| Mean | 56.7% | 64.2% |
| Median | 57.6% | 63.6% |
| Interquartile 25% (IQ1) | 51.5% | 57.4% |
| Interquartile 75% (IQ3) | 61.5% | 70.1% |
| Interquartile Range (IQR) | 10.0% | 12.7% |
| Standard Deviation (Sample) | 10.9% | 14.9% |
| Standard Deviation (Population) | 10.8% | 14.8% |
Similar Demographics by College, 1 year or more
Demographics Similar to Colombians by College, 1 year or more
In terms of college, 1 year or more, the demographic groups most similar to Colombians are Peruvian (58.6%, a difference of 0.010%), Costa Rican (58.6%, a difference of 0.080%), Immigrants from Philippines (58.7%, a difference of 0.10%), Dutch (58.6%, a difference of 0.10%), and Guamanian/Chamorro (58.6%, a difference of 0.10%).
| Demographics | Rating | Rank | College, 1 year or more |
| South Americans | 35.9 /100 | #185 | Fair 59.0% |
| Scotch-Irish | 34.7 /100 | #186 | Fair 58.9% |
| Germans | 34.7 /100 | #187 | Fair 58.9% |
| French | 34.4 /100 | #188 | Fair 58.9% |
| Uruguayans | 31.8 /100 | #189 | Fair 58.8% |
| Immigrants | Cameroon | 31.2 /100 | #190 | Fair 58.8% |
| Immigrants | Philippines | 29.2 /100 | #191 | Fair 58.7% |
| Colombians | 27.6 /100 | #192 | Fair 58.7% |
| Peruvians | 27.5 /100 | #193 | Fair 58.6% |
| Costa Ricans | 26.4 /100 | #194 | Fair 58.6% |
| Dutch | 26.2 /100 | #195 | Fair 58.6% |
| Guamanians/Chamorros | 26.2 /100 | #196 | Fair 58.6% |
| Immigrants | Thailand | 26.0 /100 | #197 | Fair 58.6% |
| Immigrants | South Eastern Asia | 25.1 /100 | #198 | Fair 58.5% |
| Slovaks | 24.6 /100 | #199 | Fair 58.5% |
Demographics Similar to New Zealanders by College, 1 year or more
In terms of college, 1 year or more, the demographic groups most similar to New Zealanders are Immigrants from Bulgaria (64.6%, a difference of 0.040%), Bhutanese (64.6%, a difference of 0.070%), Australian (64.6%, a difference of 0.070%), Immigrants from Lithuania (64.6%, a difference of 0.080%), and Immigrants from Norway (64.7%, a difference of 0.25%).
| Demographics | Rating | Rank | College, 1 year or more |
| Immigrants | Latvia | 99.9 /100 | #42 | Exceptional 64.8% |
| Immigrants | Russia | 99.9 /100 | #43 | Exceptional 64.7% |
| Immigrants | Norway | 99.9 /100 | #44 | Exceptional 64.7% |
| Immigrants | Lithuania | 99.9 /100 | #45 | Exceptional 64.6% |
| Bhutanese | 99.9 /100 | #46 | Exceptional 64.6% |
| Australians | 99.9 /100 | #47 | Exceptional 64.6% |
| Immigrants | Bulgaria | 99.9 /100 | #48 | Exceptional 64.6% |
| New Zealanders | 99.9 /100 | #49 | Exceptional 64.6% |
| Immigrants | Austria | 99.8 /100 | #50 | Exceptional 64.4% |
| Immigrants | Malaysia | 99.8 /100 | #51 | Exceptional 64.3% |
| Immigrants | Netherlands | 99.8 /100 | #52 | Exceptional 64.2% |
| Asians | 99.8 /100 | #53 | Exceptional 64.2% |
| Zimbabweans | 99.8 /100 | #54 | Exceptional 64.2% |
| Immigrants | Belarus | 99.7 /100 | #55 | Exceptional 64.1% |
| Immigrants | Czechoslovakia | 99.7 /100 | #56 | Exceptional 64.1% |