Colombian vs Immigrants from Bahamas 9th Grade

COMPARE

Colombian
Race
Ancestry
AfghanAfricanAlaska NativeAlaskan AthabascanAlbanianAleutAlsatianAmericanApacheArabArapahoArgentineanArmenianAssyrian/Chaldean/SyriacAustralianAustrianBahamianBangladeshiBarbadianBasqueBelgianBelizeanBermudanBhutaneseBlackfeetBolivianBrazilianBritishBritish West IndianBulgarianBurmeseCajunCambodianCanadianCape VerdeanCarpatho RusynCelticCentral AmericanCentral American IndianCherokeeCheyenneChickasawChileanChineseChippewaChoctawColombianColvilleComancheCosta RicanCreeCreekCroatianCrowCubanCypriotCzechCzechoslovakianDanishDelawareDominicanDutchDutch West IndianEastern EuropeanEcuadorianEgyptianEnglishEstonianEthiopianEuropeanFijianFilipinoFinnishFrenchFrench American IndianFrench CanadianGermanGerman RussianGhanaianGreekGuamanian/ChamorroGuatemalanGuyaneseHaitianHmongHonduranHopiHoumaHungarianIcelanderIndian (Asian)IndonesianInupiatIranianIraqiIrishIroquoisIsraeliItalianJamaicanJapaneseJordanianKenyanKiowaKoreanLaotianLatvianLebaneseLiberianLithuanianLumbeeLuxembourgerMacedonianMalaysianMalteseMarshalleseMenomineeMexicanMexican American IndianMongolianMoroccanNative HawaiianNavajoNepaleseNew ZealanderNicaraguanNigerianNorthern EuropeanNorwegianOkinawanOsageOttawaPaiutePakistaniPalestinianPanamanianParaguayanPennsylvania GermanPeruvianPimaPolishPortuguesePotawatomiPuebloPuerto RicanPuget Sound SalishRomanianRussianSalvadoranSamoanScandinavianScotch-IrishScottishSeminoleSenegaleseSerbianShoshoneSierra LeoneanSiouxSlavicSlovakSloveneSomaliSouth AfricanSouth AmericanSouth American IndianSoviet UnionSpaniardSpanishSpanish AmericanSpanish American IndianSri LankanSubsaharan AfricanSudaneseSwedishSwissSyrianTaiwaneseThaiTlingit-HaidaTohono O'OdhamTonganTrinidadian and TobagonianTsimshianTurkishU.S. Virgin IslanderUgandanUkrainianUruguayanUteVenezuelanVietnameseWelshWest IndianYakamaYaquiYugoslavianYumanYup'ikZimbabwean
Immigration
NonimmigrantsImmigrantsAfghanistanAfricaAlbaniaArgentinaArmeniaAsiaAustraliaAustriaBangladeshBarbadosBelarusBelgiumBelizeBoliviaBosnia and HerzegovinaBrazilBulgariaBurma/MyanmarCabo VerdeCambodiaCameroonCanadaCaribbeanCentral AmericaChileChinaColombiaCongoCosta RicaCroatiaCubaCzechoslovakiaDenmarkDominicaDominican RepublicEastern AfricaEastern AsiaEastern EuropeEcuadorEgyptEl SalvadorEnglandEritreaEthiopiaEuropeFijiFranceGermanyGhanaGreeceGrenadaGuatemalaGuyanaHaitiHondurasHong KongHungaryIndiaIndonesiaIranIraqIrelandIsraelItalyJamaicaJapanJordanKazakhstanKenyaKoreaKuwaitLaosLatin AmericaLatviaLebanonLiberiaLithuaniaMalaysiaMexicoMicronesiaMiddle AfricaMoldovaMoroccoNepalNetherlandsNicaraguaNigeriaNorth AmericaNorth MacedoniaNorthern AfricaNorthern EuropeNorwayOceaniaPakistanPanamaPeruPhilippinesPolandPortugalRomaniaRussiaSaudi ArabiaScotlandSenegalSerbiaSierra LeoneSingaporeSomaliaSouth AfricaSouth AmericaSouth Central AsiaSouth Eastern AsiaSouthern EuropeSpainSri LankaSt. Vincent and the GrenadinesSudanSwedenSwitzerlandSyriaTaiwanThailandTrinidad and TobagoTurkeyUgandaUkraineUruguayUzbekistanVenezuelaVietnamWest IndiesWestern AfricaWestern AsiaWestern EuropeYemenZaireZimbabweAzores
Immigrants from Bahamas
Race
Ancestry
AfghanAfricanAlaska NativeAlaskan AthabascanAlbanianAleutAlsatianAmericanApacheArabArapahoArgentineanArmenianAssyrian/Chaldean/SyriacAustralianAustrianBahamianBangladeshiBarbadianBasqueBelgianBelizeanBermudanBhutaneseBlackfeetBolivianBrazilianBritishBritish West IndianBulgarianBurmeseCajunCambodianCanadianCape VerdeanCarpatho RusynCelticCentral AmericanCentral American IndianCherokeeCheyenneChickasawChileanChineseChippewaChoctawColvilleComancheCosta RicanCreeCreekCroatianCrowCubanCypriotCzechCzechoslovakianDanishDelawareDominicanDutchDutch West IndianEastern EuropeanEcuadorianEgyptianEnglishEstonianEthiopianEuropeanFijianFilipinoFinnishFrenchFrench American IndianFrench CanadianGermanGerman RussianGhanaianGreekGuamanian/ChamorroGuatemalanGuyaneseHaitianHmongHonduranHopiHoumaHungarianIcelanderIndian (Asian)IndonesianInupiatIranianIraqiIrishIroquoisIsraeliItalianJamaicanJapaneseJordanianKenyanKiowaKoreanLaotianLatvianLebaneseLiberianLithuanianLumbeeLuxembourgerMacedonianMalaysianMalteseMarshalleseMenomineeMexicanMexican American IndianMongolianMoroccanNative HawaiianNavajoNepaleseNew ZealanderNicaraguanNigerianNorthern EuropeanNorwegianOkinawanOsageOttawaPaiutePakistaniPalestinianPanamanianParaguayanPennsylvania GermanPeruvianPimaPolishPortuguesePotawatomiPuebloPuerto RicanPuget Sound SalishRomanianRussianSalvadoranSamoanScandinavianScotch-IrishScottishSeminoleSenegaleseSerbianShoshoneSierra LeoneanSiouxSlavicSlovakSloveneSomaliSouth AfricanSouth AmericanSouth American IndianSoviet UnionSpaniardSpanishSpanish AmericanSpanish American IndianSri LankanSubsaharan AfricanSudaneseSwedishSwissSyrianTaiwaneseThaiTlingit-HaidaTohono O'OdhamTonganTrinidadian and TobagonianTsimshianTurkishU.S. Virgin IslanderUgandanUkrainianUruguayanUteVenezuelanVietnameseWelshWest IndianYakamaYaquiYugoslavianYumanYup'ikZimbabwean
Immigration
NonimmigrantsImmigrantsAfghanistanAfricaAlbaniaArgentinaArmeniaAsiaAustraliaAustriaBahamasBangladeshBarbadosBelarusBelgiumBelizeBoliviaBosnia and HerzegovinaBrazilBulgariaBurma/MyanmarCabo VerdeCambodiaCameroonCanadaCaribbeanCentral AmericaChileChinaColombiaCongoCosta RicaCroatiaCubaCzechoslovakiaDenmarkDominicaDominican RepublicEastern AfricaEastern AsiaEastern EuropeEcuadorEgyptEl SalvadorEnglandEritreaEthiopiaEuropeFijiFranceGermanyGhanaGreeceGrenadaGuatemalaGuyanaHaitiHondurasHong KongHungaryIndiaIndonesiaIranIraqIrelandIsraelItalyJamaicaJapanJordanKazakhstanKenyaKoreaKuwaitLaosLatin AmericaLatviaLebanonLiberiaLithuaniaMalaysiaMexicoMicronesiaMiddle AfricaMoldovaMoroccoNepalNetherlandsNicaraguaNigeriaNorth AmericaNorth MacedoniaNorthern AfricaNorthern EuropeNorwayOceaniaPakistanPanamaPeruPhilippinesPolandPortugalRomaniaRussiaSaudi ArabiaScotlandSenegalSerbiaSierra LeoneSingaporeSomaliaSouth AfricaSouth AmericaSouth Central AsiaSouth Eastern AsiaSouthern EuropeSpainSri LankaSt. Vincent and the GrenadinesSudanSwedenSwitzerlandSyriaTaiwanThailandTrinidad and TobagoTurkeyUgandaUkraineUruguayUzbekistanVenezuelaVietnamWest IndiesWestern AfricaWestern AsiaWestern EuropeYemenZaireZimbabweAzores
9th Grade
Income
Poverty
Unemployment
Labor Participation
Family Structure
Vehicle Availability
Education Level
Disability

9th Grade Comparison

Colombians

Immigrants from Bahamas

Tragic
Poor
94.0%
9TH GRADE
0.8/ 100
METRIC RATING
253rd/ 347
METRIC RANK
94.6%
9TH GRADE
19.8/ 100
METRIC RATING
203rd/ 347
METRIC RANK

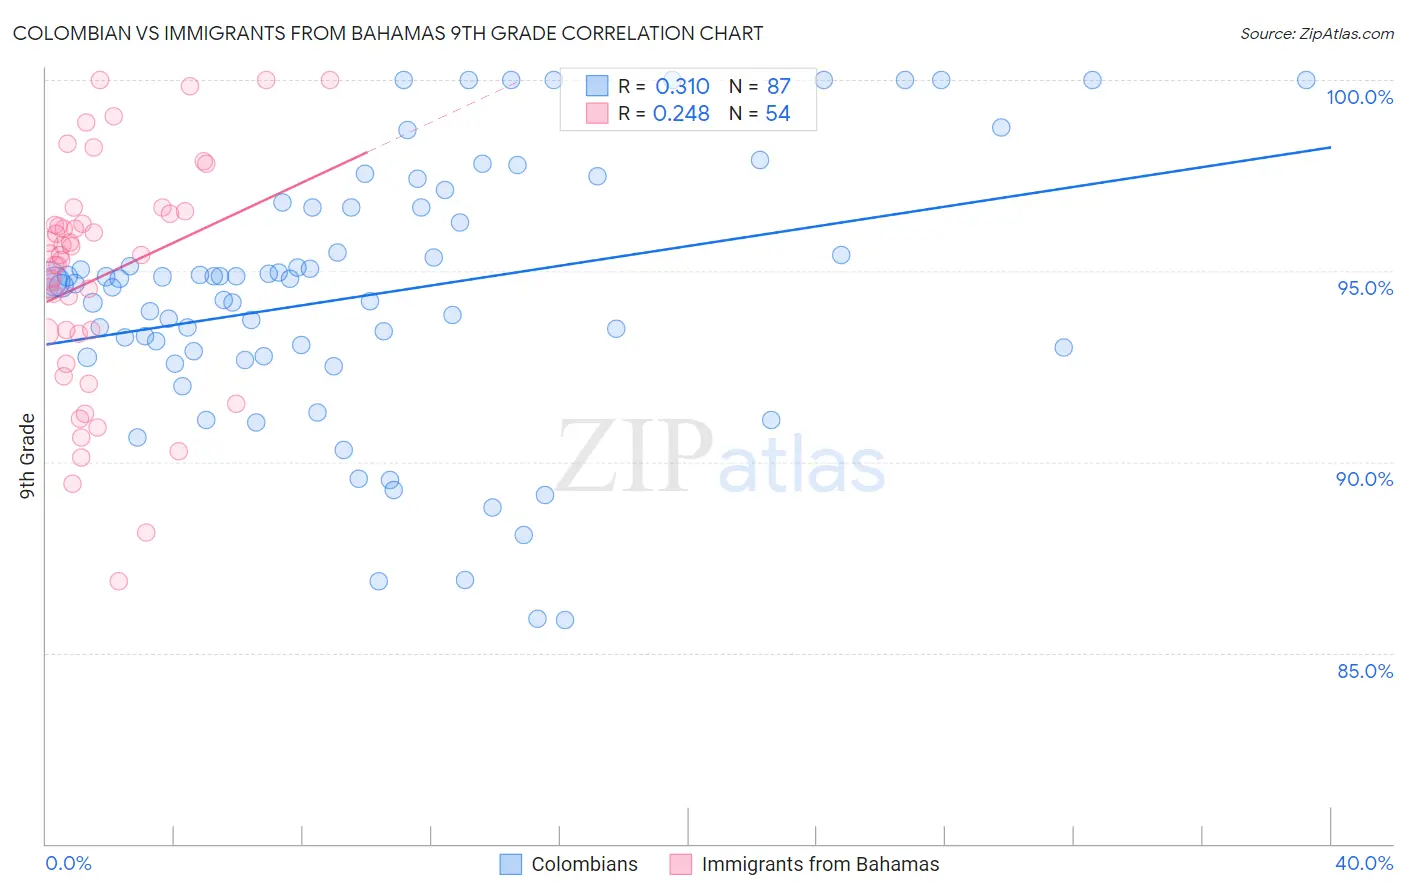
Colombian vs Immigrants from Bahamas 9th Grade Correlation Chart

The statistical analysis conducted on geographies consisting of 419,655,116 people shows a mild positive correlation between the proportion of Colombians and percentage of population with at least 9th grade education in the United States with a correlation coefficient (R) of 0.310 and weighted average of 94.0%. Similarly, the statistical analysis conducted on geographies consisting of 104,666,801 people shows a weak positive correlation between the proportion of Immigrants from Bahamas and percentage of population with at least 9th grade education in the United States with a correlation coefficient (R) of 0.248 and weighted average of 94.6%, a difference of 0.62%.
Colombian vs Immigrants from Bahamas 9th Grade

9th Grade Correlation Summary

MeasurementColombianImmigrants from Bahamas
Minimum85.8%86.9%
Maximum100.0%100.0%
Range14.2%13.1%
Mean94.4%94.9%
Median94.7%95.4%
Interquartile 25% (IQ1)92.8%93.3%
Interquartile 75% (IQ3)96.7%96.5%
Interquartile Range (IQR)3.9%3.1%
Standard Deviation (Sample)3.4%3.0%
Standard Deviation (Population)3.4%3.0%

Similar Demographics by 9th Grade

Demographics Similar to Colombians by 9th Grade

In terms of 9th grade, the demographic groups most similar to Colombians are Immigrants from Senegal (94.1%, a difference of 0.020%), Jamaican (94.1%, a difference of 0.030%), U.S. Virgin Islander (94.0%, a difference of 0.030%), Immigrants from Nigeria (94.0%, a difference of 0.070%), and Uruguayan (94.1%, a difference of 0.080%).
DemographicsRating | Rank9th Grade
Senegalese
1.9
/100
|
#246
Tragic
94.2%
Afghans
1.8
/100
|
#247
Tragic
94.2%
Immigrants | Somalia
1.4
/100
|
#248
Tragic
94.1%
Uruguayans
1.3
/100
|
#249
Tragic
94.1%
Immigrants | Hong Kong
1.3
/100
|
#250
Tragic
94.1%
Jamaicans
1.0
/100
|
#251
Tragic
94.1%
Immigrants | Senegal
0.9
/100
|
#252
Tragic
94.1%
Colombians
0.8
/100
|
#253
Tragic
94.0%
U.S. Virgin Islanders
0.7
/100
|
#254
Tragic
94.0%
Immigrants | Nigeria
0.6
/100
|
#255
Tragic
94.0%
Immigrants | Afghanistan
0.5
/100
|
#256
Tragic
94.0%
Immigrants | Costa Rica
0.5
/100
|
#257
Tragic
94.0%
Immigrants | Thailand
0.5
/100
|
#258
Tragic
93.9%
Ghanaians
0.5
/100
|
#259
Tragic
93.9%
Pima
0.4
/100
|
#260
Tragic
93.9%

Demographics Similar to Immigrants from Bahamas by 9th Grade

In terms of 9th grade, the demographic groups most similar to Immigrants from Bahamas are Immigrants from Eastern Asia (94.6%, a difference of 0.0%), Moroccan (94.6%, a difference of 0.0%), Laotian (94.6%, a difference of 0.010%), Immigrants from Zaire (94.6%, a difference of 0.010%), and Black/African American (94.6%, a difference of 0.010%).
DemographicsRating | Rank9th Grade
Immigrants | Lebanon
27.2
/100
|
#196
Fair
94.7%
Immigrants | Micronesia
24.7
/100
|
#197
Fair
94.7%
Hawaiians
22.7
/100
|
#198
Fair
94.7%
Laotians
21.0
/100
|
#199
Fair
94.6%
Immigrants | Zaire
20.6
/100
|
#200
Fair
94.6%
Blacks/African Americans
20.5
/100
|
#201
Fair
94.6%
Immigrants | Eastern Asia
19.8
/100
|
#202
Poor
94.6%
Immigrants | Bahamas
19.8
/100
|
#203
Poor
94.6%
Moroccans
19.6
/100
|
#204
Poor
94.6%
Immigrants | Sudan
17.6
/100
|
#205
Poor
94.6%
Samoans
17.3
/100
|
#206
Poor
94.6%
Immigrants | Morocco
16.3
/100
|
#207
Poor
94.6%
Immigrants | Pakistan
15.5
/100
|
#208
Poor
94.6%
Comanche
14.9
/100
|
#209
Poor
94.6%
Immigrants | Chile
13.4
/100
|
#210
Poor
94.5%