Swedish vs Nonimmigrants Associate's Degree
COMPARE
Swedish
Nonimmigrants
Associate's Degree
Associate's Degree Comparison
Swedes
Nonimmigrants
48.4%
ASSOCIATE'S DEGREE
91.5/ 100
METRIC RATING
129th/ 347
METRIC RANK
42.9%
ASSOCIATE'S DEGREE
1.9/ 100
METRIC RATING
237th/ 347
METRIC RANK
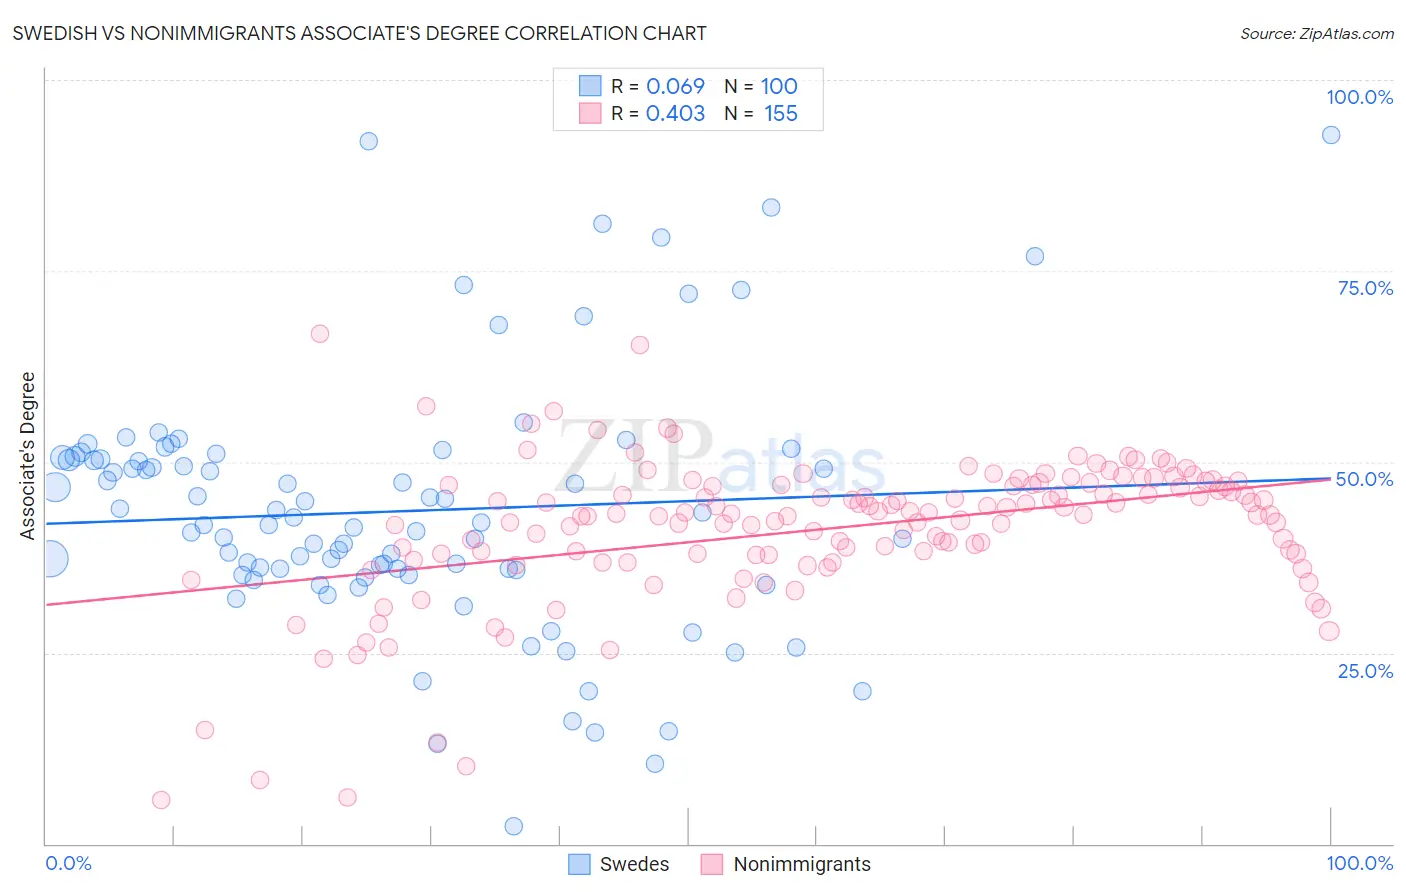
Swedish vs Nonimmigrants Associate's Degree Correlation Chart
The statistical analysis conducted on geographies consisting of 539,194,795 people shows a slight positive correlation between the proportion of Swedes and percentage of population with at least associate's degree education in the United States with a correlation coefficient (R) of 0.069 and weighted average of 48.4%. Similarly, the statistical analysis conducted on geographies consisting of 585,078,225 people shows a moderate positive correlation between the proportion of Nonimmigrants and percentage of population with at least associate's degree education in the United States with a correlation coefficient (R) of 0.403 and weighted average of 42.9%, a difference of 12.8%.
Associate's Degree Correlation Summary
| Measurement | Swedish | Nonimmigrants |
| Minimum | 2.3% | 5.7% |
| Maximum | 92.9% | 66.8% |
| Range | 90.6% | 61.1% |
| Mean | 43.5% | 41.2% |
| Median | 41.9% | 43.1% |
| Interquartile 25% (IQ1) | 35.6% | 37.8% |
| Interquartile 75% (IQ3) | 50.4% | 47.0% |
| Interquartile Range (IQR) | 14.9% | 9.2% |
| Standard Deviation (Sample) | 16.5% | 9.6% |
| Standard Deviation (Population) | 16.4% | 9.6% |
Similar Demographics by Associate's Degree
Demographics Similar to Swedes by Associate's Degree
In terms of associate's degree, the demographic groups most similar to Swedes are Immigrants from Eastern Africa (48.4%, a difference of 0.030%), Immigrants from Jordan (48.4%, a difference of 0.060%), Immigrants from Uganda (48.5%, a difference of 0.15%), Immigrants from Syria (48.5%, a difference of 0.16%), and Icelander (48.3%, a difference of 0.16%).
| Demographics | Rating | Rank | Associate's Degree |
| Italians | 93.9 /100 | #122 | Exceptional 48.7% |
| Brazilians | 93.7 /100 | #123 | Exceptional 48.7% |
| Serbians | 92.6 /100 | #124 | Exceptional 48.5% |
| Chinese | 92.5 /100 | #125 | Exceptional 48.5% |
| Immigrants | Syria | 92.2 /100 | #126 | Exceptional 48.5% |
| Immigrants | Uganda | 92.1 /100 | #127 | Exceptional 48.5% |
| Immigrants | Eastern Africa | 91.6 /100 | #128 | Exceptional 48.4% |
| Swedes | 91.5 /100 | #129 | Exceptional 48.4% |
| Immigrants | Jordan | 91.2 /100 | #130 | Exceptional 48.4% |
| Icelanders | 90.8 /100 | #131 | Exceptional 48.3% |
| Immigrants | Albania | 89.9 /100 | #132 | Excellent 48.2% |
| Assyrians/Chaldeans/Syriacs | 89.4 /100 | #133 | Excellent 48.2% |
| Moroccans | 89.3 /100 | #134 | Excellent 48.2% |
| Europeans | 89.0 /100 | #135 | Excellent 48.2% |
| Pakistanis | 88.0 /100 | #136 | Excellent 48.1% |
Demographics Similar to Nonimmigrants by Associate's Degree
In terms of associate's degree, the demographic groups most similar to Nonimmigrants are Immigrants from St. Vincent and the Grenadines (42.9%, a difference of 0.020%), Ecuadorian (43.0%, a difference of 0.10%), Tlingit-Haida (43.0%, a difference of 0.20%), Iroquois (42.8%, a difference of 0.26%), and Tongan (43.0%, a difference of 0.29%).
| Demographics | Rating | Rank | Associate's Degree |
| Immigrants | Barbados | 2.9 /100 | #230 | Tragic 43.3% |
| Liberians | 2.9 /100 | #231 | Tragic 43.3% |
| Native Hawaiians | 2.3 /100 | #232 | Tragic 43.1% |
| Tongans | 2.2 /100 | #233 | Tragic 43.0% |
| Tlingit-Haida | 2.1 /100 | #234 | Tragic 43.0% |
| Ecuadorians | 2.0 /100 | #235 | Tragic 43.0% |
| Immigrants | St. Vincent and the Grenadines | 1.9 /100 | #236 | Tragic 42.9% |
| Immigrants | Nonimmigrants | 1.9 /100 | #237 | Tragic 42.9% |
| Iroquois | 1.7 /100 | #238 | Tragic 42.8% |
| Immigrants | Grenada | 1.3 /100 | #239 | Tragic 42.6% |
| Cree | 1.2 /100 | #240 | Tragic 42.5% |
| British West Indians | 1.0 /100 | #241 | Tragic 42.4% |
| Immigrants | West Indies | 1.0 /100 | #242 | Tragic 42.4% |
| Guyanese | 1.0 /100 | #243 | Tragic 42.3% |
| Immigrants | Liberia | 0.9 /100 | #244 | Tragic 42.3% |