Paraguayan vs Nonimmigrants Associate's Degree
COMPARE
Paraguayan
Nonimmigrants
Associate's Degree
Associate's Degree Comparison
Paraguayans
Nonimmigrants
51.8%
ASSOCIATE'S DEGREE
99.8/ 100
METRIC RATING
57th/ 347
METRIC RANK
42.9%
ASSOCIATE'S DEGREE
1.9/ 100
METRIC RATING
237th/ 347
METRIC RANK
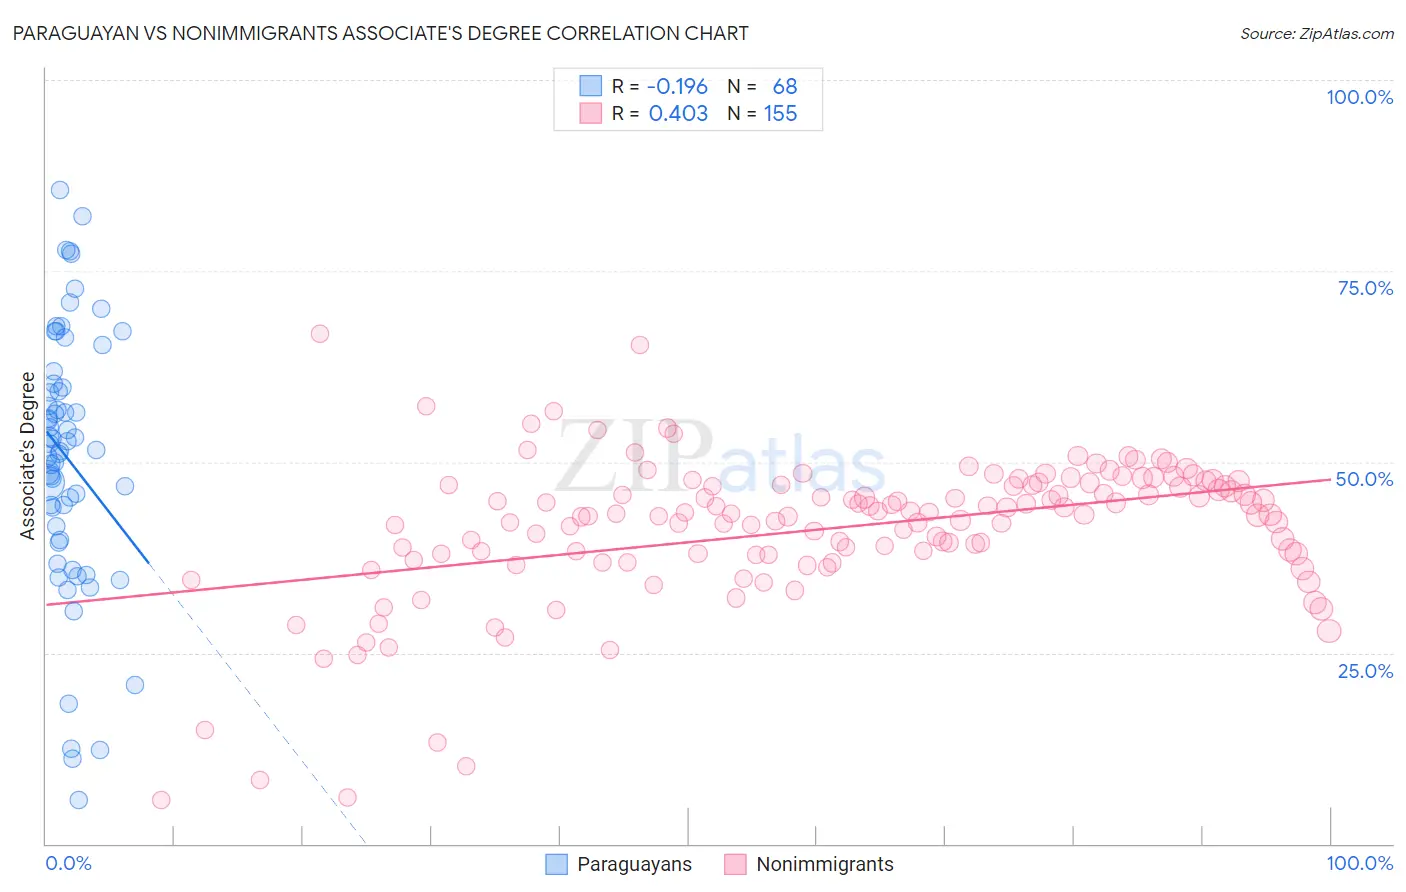
Paraguayan vs Nonimmigrants Associate's Degree Correlation Chart
The statistical analysis conducted on geographies consisting of 95,113,072 people shows a poor negative correlation between the proportion of Paraguayans and percentage of population with at least associate's degree education in the United States with a correlation coefficient (R) of -0.196 and weighted average of 51.8%. Similarly, the statistical analysis conducted on geographies consisting of 585,078,225 people shows a moderate positive correlation between the proportion of Nonimmigrants and percentage of population with at least associate's degree education in the United States with a correlation coefficient (R) of 0.403 and weighted average of 42.9%, a difference of 20.7%.
Associate's Degree Correlation Summary
| Measurement | Paraguayan | Nonimmigrants |
| Minimum | 5.7% | 5.7% |
| Maximum | 85.7% | 66.8% |
| Range | 79.9% | 61.1% |
| Mean | 50.4% | 41.2% |
| Median | 52.0% | 43.1% |
| Interquartile 25% (IQ1) | 40.7% | 37.8% |
| Interquartile 75% (IQ3) | 60.0% | 47.0% |
| Interquartile Range (IQR) | 19.3% | 9.2% |
| Standard Deviation (Sample) | 17.1% | 9.6% |
| Standard Deviation (Population) | 17.0% | 9.6% |
Similar Demographics by Associate's Degree
Demographics Similar to Paraguayans by Associate's Degree
In terms of associate's degree, the demographic groups most similar to Paraguayans are New Zealander (51.8%, a difference of 0.030%), Immigrants from Czechoslovakia (51.9%, a difference of 0.12%), Australian (51.9%, a difference of 0.14%), Immigrants from Serbia (51.7%, a difference of 0.16%), and Immigrants from Spain (51.9%, a difference of 0.17%).
| Demographics | Rating | Rank | Associate's Degree |
| Asians | 99.9 /100 | #50 | Exceptional 52.1% |
| Immigrants | Greece | 99.9 /100 | #51 | Exceptional 52.1% |
| Bolivians | 99.8 /100 | #52 | Exceptional 52.0% |
| Immigrants | Asia | 99.8 /100 | #53 | Exceptional 52.0% |
| Immigrants | Spain | 99.8 /100 | #54 | Exceptional 51.9% |
| Australians | 99.8 /100 | #55 | Exceptional 51.9% |
| Immigrants | Czechoslovakia | 99.8 /100 | #56 | Exceptional 51.9% |
| Paraguayans | 99.8 /100 | #57 | Exceptional 51.8% |
| New Zealanders | 99.8 /100 | #58 | Exceptional 51.8% |
| Immigrants | Serbia | 99.8 /100 | #59 | Exceptional 51.7% |
| Immigrants | Bolivia | 99.7 /100 | #60 | Exceptional 51.5% |
| Immigrants | Kazakhstan | 99.7 /100 | #61 | Exceptional 51.4% |
| Bhutanese | 99.7 /100 | #62 | Exceptional 51.4% |
| South Africans | 99.7 /100 | #63 | Exceptional 51.4% |
| Immigrants | Netherlands | 99.7 /100 | #64 | Exceptional 51.4% |
Demographics Similar to Nonimmigrants by Associate's Degree
In terms of associate's degree, the demographic groups most similar to Nonimmigrants are Immigrants from St. Vincent and the Grenadines (42.9%, a difference of 0.020%), Ecuadorian (43.0%, a difference of 0.10%), Tlingit-Haida (43.0%, a difference of 0.20%), Iroquois (42.8%, a difference of 0.26%), and Tongan (43.0%, a difference of 0.29%).
| Demographics | Rating | Rank | Associate's Degree |
| Immigrants | Barbados | 2.9 /100 | #230 | Tragic 43.3% |
| Liberians | 2.9 /100 | #231 | Tragic 43.3% |
| Native Hawaiians | 2.3 /100 | #232 | Tragic 43.1% |
| Tongans | 2.2 /100 | #233 | Tragic 43.0% |
| Tlingit-Haida | 2.1 /100 | #234 | Tragic 43.0% |
| Ecuadorians | 2.0 /100 | #235 | Tragic 43.0% |
| Immigrants | St. Vincent and the Grenadines | 1.9 /100 | #236 | Tragic 42.9% |
| Immigrants | Nonimmigrants | 1.9 /100 | #237 | Tragic 42.9% |
| Iroquois | 1.7 /100 | #238 | Tragic 42.8% |
| Immigrants | Grenada | 1.3 /100 | #239 | Tragic 42.6% |
| Cree | 1.2 /100 | #240 | Tragic 42.5% |
| British West Indians | 1.0 /100 | #241 | Tragic 42.4% |
| Immigrants | West Indies | 1.0 /100 | #242 | Tragic 42.4% |
| Guyanese | 1.0 /100 | #243 | Tragic 42.3% |
| Immigrants | Liberia | 0.9 /100 | #244 | Tragic 42.3% |