Norwegian vs Nonimmigrants Associate's Degree
COMPARE
Norwegian
Nonimmigrants
Associate's Degree
Associate's Degree Comparison
Norwegians
Nonimmigrants
47.6%
ASSOCIATE'S DEGREE
81.0/ 100
METRIC RATING
143rd/ 347
METRIC RANK
42.9%
ASSOCIATE'S DEGREE
1.9/ 100
METRIC RATING
237th/ 347
METRIC RANK
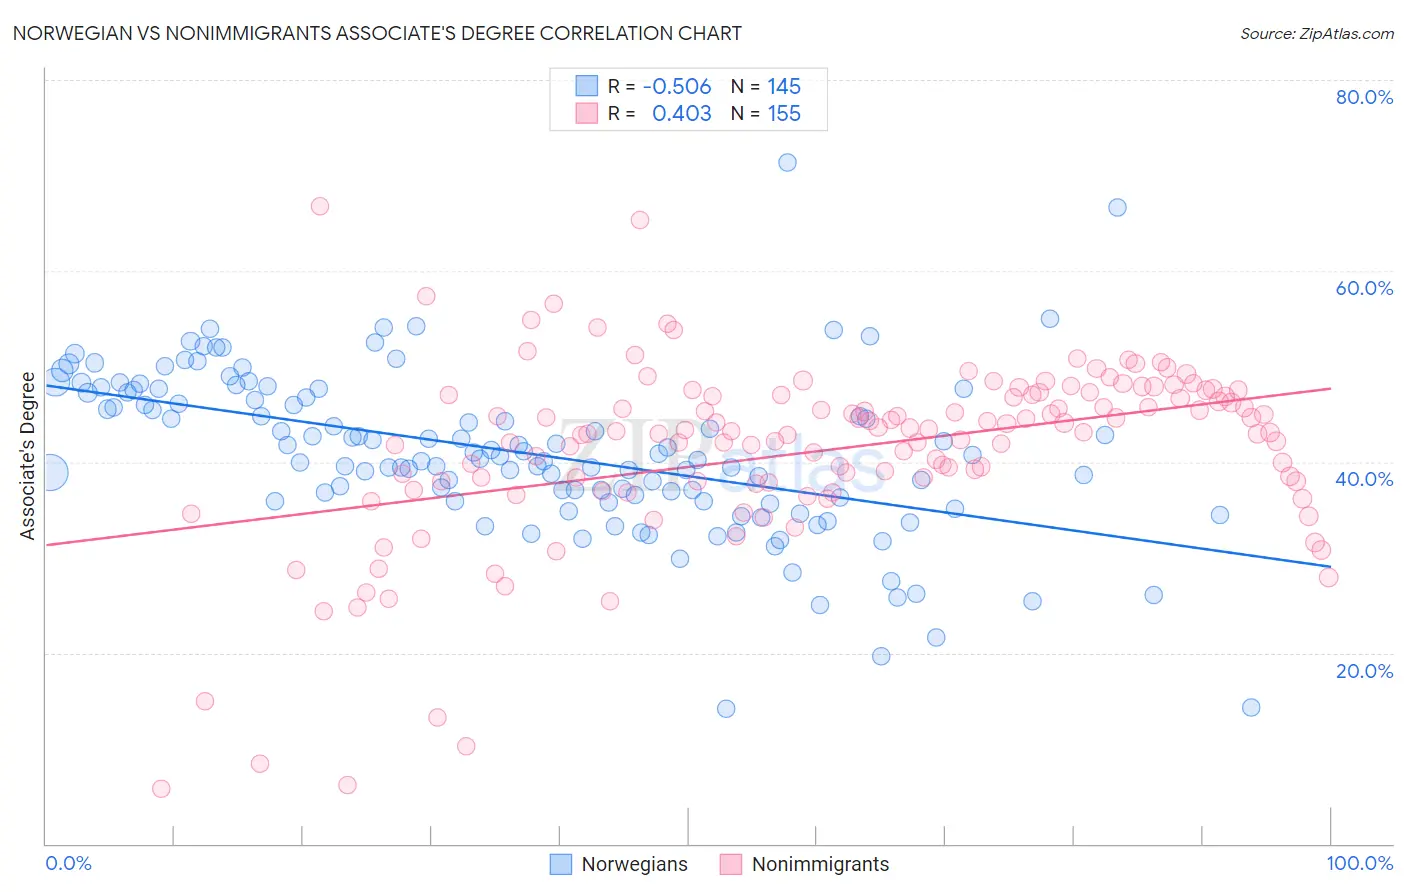
Norwegian vs Nonimmigrants Associate's Degree Correlation Chart
The statistical analysis conducted on geographies consisting of 533,342,893 people shows a substantial negative correlation between the proportion of Norwegians and percentage of population with at least associate's degree education in the United States with a correlation coefficient (R) of -0.506 and weighted average of 47.6%. Similarly, the statistical analysis conducted on geographies consisting of 585,078,225 people shows a moderate positive correlation between the proportion of Nonimmigrants and percentage of population with at least associate's degree education in the United States with a correlation coefficient (R) of 0.403 and weighted average of 42.9%, a difference of 10.9%.
Associate's Degree Correlation Summary
| Measurement | Norwegian | Nonimmigrants |
| Minimum | 14.2% | 5.7% |
| Maximum | 71.4% | 66.8% |
| Range | 57.2% | 61.1% |
| Mean | 40.9% | 41.2% |
| Median | 40.6% | 43.1% |
| Interquartile 25% (IQ1) | 35.9% | 37.8% |
| Interquartile 75% (IQ3) | 47.3% | 47.0% |
| Interquartile Range (IQR) | 11.4% | 9.2% |
| Standard Deviation (Sample) | 8.6% | 9.6% |
| Standard Deviation (Population) | 8.6% | 9.6% |
Similar Demographics by Associate's Degree
Demographics Similar to Norwegians by Associate's Degree
In terms of associate's degree, the demographic groups most similar to Norwegians are Slavic (47.6%, a difference of 0.060%), Sierra Leonean (47.7%, a difference of 0.23%), Canadian (47.5%, a difference of 0.23%), Taiwanese (47.7%, a difference of 0.28%), and Immigrants from Sudan (47.4%, a difference of 0.36%).
| Demographics | Rating | Rank | Associate's Degree |
| Pakistanis | 88.0 /100 | #136 | Excellent 48.1% |
| Immigrants | Eritrea | 87.8 /100 | #137 | Excellent 48.1% |
| Poles | 87.3 /100 | #138 | Excellent 48.0% |
| Slovenes | 85.1 /100 | #139 | Excellent 47.9% |
| Immigrants | Southern Europe | 84.4 /100 | #140 | Excellent 47.8% |
| Taiwanese | 83.3 /100 | #141 | Excellent 47.7% |
| Sierra Leoneans | 82.9 /100 | #142 | Excellent 47.7% |
| Norwegians | 81.0 /100 | #143 | Excellent 47.6% |
| Slavs | 80.5 /100 | #144 | Excellent 47.6% |
| Canadians | 79.0 /100 | #145 | Good 47.5% |
| Immigrants | Sudan | 77.9 /100 | #146 | Good 47.4% |
| Danes | 77.3 /100 | #147 | Good 47.4% |
| South American Indians | 76.7 /100 | #148 | Good 47.4% |
| Immigrants | Armenia | 76.6 /100 | #149 | Good 47.4% |
| Iraqis | 76.2 /100 | #150 | Good 47.4% |
Demographics Similar to Nonimmigrants by Associate's Degree
In terms of associate's degree, the demographic groups most similar to Nonimmigrants are Immigrants from St. Vincent and the Grenadines (42.9%, a difference of 0.020%), Ecuadorian (43.0%, a difference of 0.10%), Tlingit-Haida (43.0%, a difference of 0.20%), Iroquois (42.8%, a difference of 0.26%), and Tongan (43.0%, a difference of 0.29%).
| Demographics | Rating | Rank | Associate's Degree |
| Immigrants | Barbados | 2.9 /100 | #230 | Tragic 43.3% |
| Liberians | 2.9 /100 | #231 | Tragic 43.3% |
| Native Hawaiians | 2.3 /100 | #232 | Tragic 43.1% |
| Tongans | 2.2 /100 | #233 | Tragic 43.0% |
| Tlingit-Haida | 2.1 /100 | #234 | Tragic 43.0% |
| Ecuadorians | 2.0 /100 | #235 | Tragic 43.0% |
| Immigrants | St. Vincent and the Grenadines | 1.9 /100 | #236 | Tragic 42.9% |
| Immigrants | Nonimmigrants | 1.9 /100 | #237 | Tragic 42.9% |
| Iroquois | 1.7 /100 | #238 | Tragic 42.8% |
| Immigrants | Grenada | 1.3 /100 | #239 | Tragic 42.6% |
| Cree | 1.2 /100 | #240 | Tragic 42.5% |
| British West Indians | 1.0 /100 | #241 | Tragic 42.4% |
| Immigrants | West Indies | 1.0 /100 | #242 | Tragic 42.4% |
| Guyanese | 1.0 /100 | #243 | Tragic 42.3% |
| Immigrants | Liberia | 0.9 /100 | #244 | Tragic 42.3% |