Laotian vs Nonimmigrants Associate's Degree
COMPARE
Laotian
Nonimmigrants
Associate's Degree
Associate's Degree Comparison
Laotians
Nonimmigrants
49.9%
ASSOCIATE'S DEGREE
98.4/ 100
METRIC RATING
94th/ 347
METRIC RANK
42.9%
ASSOCIATE'S DEGREE
1.9/ 100
METRIC RATING
237th/ 347
METRIC RANK
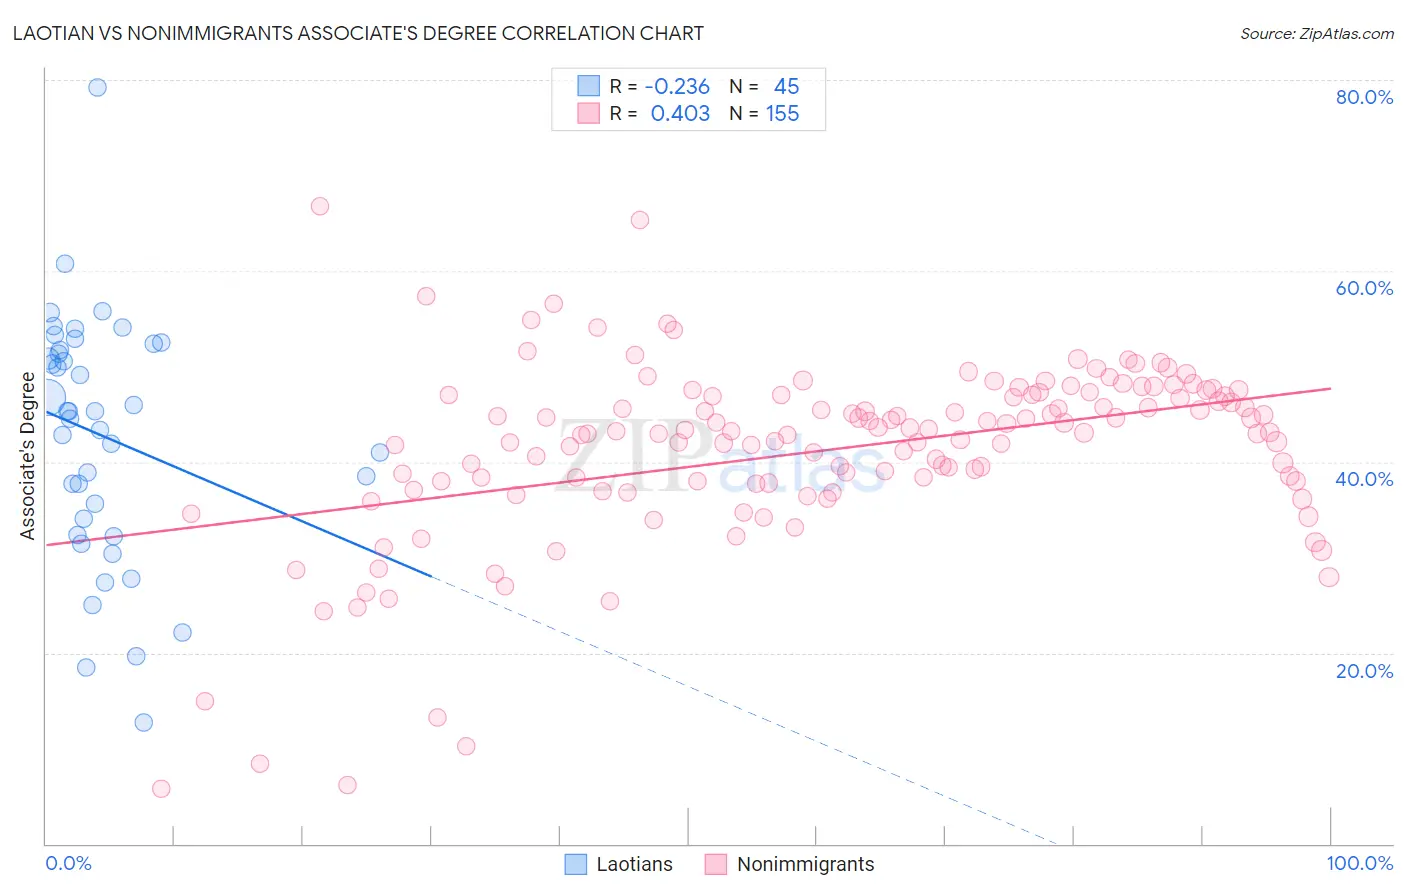
Laotian vs Nonimmigrants Associate's Degree Correlation Chart
The statistical analysis conducted on geographies consisting of 224,847,979 people shows a weak negative correlation between the proportion of Laotians and percentage of population with at least associate's degree education in the United States with a correlation coefficient (R) of -0.236 and weighted average of 49.9%. Similarly, the statistical analysis conducted on geographies consisting of 585,078,225 people shows a moderate positive correlation between the proportion of Nonimmigrants and percentage of population with at least associate's degree education in the United States with a correlation coefficient (R) of 0.403 and weighted average of 42.9%, a difference of 16.3%.
Associate's Degree Correlation Summary
| Measurement | Laotian | Nonimmigrants |
| Minimum | 12.7% | 5.7% |
| Maximum | 79.2% | 66.8% |
| Range | 66.5% | 61.1% |
| Mean | 42.7% | 41.2% |
| Median | 45.3% | 43.1% |
| Interquartile 25% (IQ1) | 33.2% | 37.8% |
| Interquartile 75% (IQ3) | 52.1% | 47.0% |
| Interquartile Range (IQR) | 18.9% | 9.2% |
| Standard Deviation (Sample) | 12.8% | 9.6% |
| Standard Deviation (Population) | 12.6% | 9.6% |
Similar Demographics by Associate's Degree
Demographics Similar to Laotians by Associate's Degree
In terms of associate's degree, the demographic groups most similar to Laotians are Immigrants from Brazil (50.0%, a difference of 0.13%), Immigrants from North America (50.1%, a difference of 0.28%), Immigrants from Western Asia (50.1%, a difference of 0.31%), Immigrants from Western Europe (50.1%, a difference of 0.39%), and Immigrants from Ethiopia (50.1%, a difference of 0.39%).
| Demographics | Rating | Rank | Associate's Degree |
| Immigrants | Moldova | 98.8 /100 | #87 | Exceptional 50.2% |
| Immigrants | Canada | 98.7 /100 | #88 | Exceptional 50.1% |
| Immigrants | Western Europe | 98.7 /100 | #89 | Exceptional 50.1% |
| Immigrants | Ethiopia | 98.7 /100 | #90 | Exceptional 50.1% |
| Immigrants | Western Asia | 98.7 /100 | #91 | Exceptional 50.1% |
| Immigrants | North America | 98.7 /100 | #92 | Exceptional 50.1% |
| Immigrants | Brazil | 98.5 /100 | #93 | Exceptional 50.0% |
| Laotians | 98.4 /100 | #94 | Exceptional 49.9% |
| Immigrants | England | 98.0 /100 | #95 | Exceptional 49.7% |
| Romanians | 98.0 /100 | #96 | Exceptional 49.7% |
| Immigrants | Ukraine | 98.0 /100 | #97 | Exceptional 49.7% |
| Immigrants | Northern Africa | 97.9 /100 | #98 | Exceptional 49.7% |
| Macedonians | 97.8 /100 | #99 | Exceptional 49.6% |
| Immigrants | Nepal | 97.5 /100 | #100 | Exceptional 49.5% |
| Northern Europeans | 97.3 /100 | #101 | Exceptional 49.5% |
Demographics Similar to Nonimmigrants by Associate's Degree
In terms of associate's degree, the demographic groups most similar to Nonimmigrants are Immigrants from St. Vincent and the Grenadines (42.9%, a difference of 0.020%), Ecuadorian (43.0%, a difference of 0.10%), Tlingit-Haida (43.0%, a difference of 0.20%), Iroquois (42.8%, a difference of 0.26%), and Tongan (43.0%, a difference of 0.29%).
| Demographics | Rating | Rank | Associate's Degree |
| Immigrants | Barbados | 2.9 /100 | #230 | Tragic 43.3% |
| Liberians | 2.9 /100 | #231 | Tragic 43.3% |
| Native Hawaiians | 2.3 /100 | #232 | Tragic 43.1% |
| Tongans | 2.2 /100 | #233 | Tragic 43.0% |
| Tlingit-Haida | 2.1 /100 | #234 | Tragic 43.0% |
| Ecuadorians | 2.0 /100 | #235 | Tragic 43.0% |
| Immigrants | St. Vincent and the Grenadines | 1.9 /100 | #236 | Tragic 42.9% |
| Immigrants | Nonimmigrants | 1.9 /100 | #237 | Tragic 42.9% |
| Iroquois | 1.7 /100 | #238 | Tragic 42.8% |
| Immigrants | Grenada | 1.3 /100 | #239 | Tragic 42.6% |
| Cree | 1.2 /100 | #240 | Tragic 42.5% |
| British West Indians | 1.0 /100 | #241 | Tragic 42.4% |
| Immigrants | West Indies | 1.0 /100 | #242 | Tragic 42.4% |
| Guyanese | 1.0 /100 | #243 | Tragic 42.3% |
| Immigrants | Liberia | 0.9 /100 | #244 | Tragic 42.3% |