Chippewa vs Immigrants from Asia Bachelor's Degree
COMPARE
Chippewa
Immigrants from Asia
Bachelor's Degree
Bachelor's Degree Comparison
Chippewa
Immigrants from Asia
30.6%
BACHELOR'S DEGREE
0.0/ 100
METRIC RATING
298th/ 347
METRIC RANK
44.3%
BACHELOR'S DEGREE
99.9/ 100
METRIC RATING
53rd/ 347
METRIC RANK
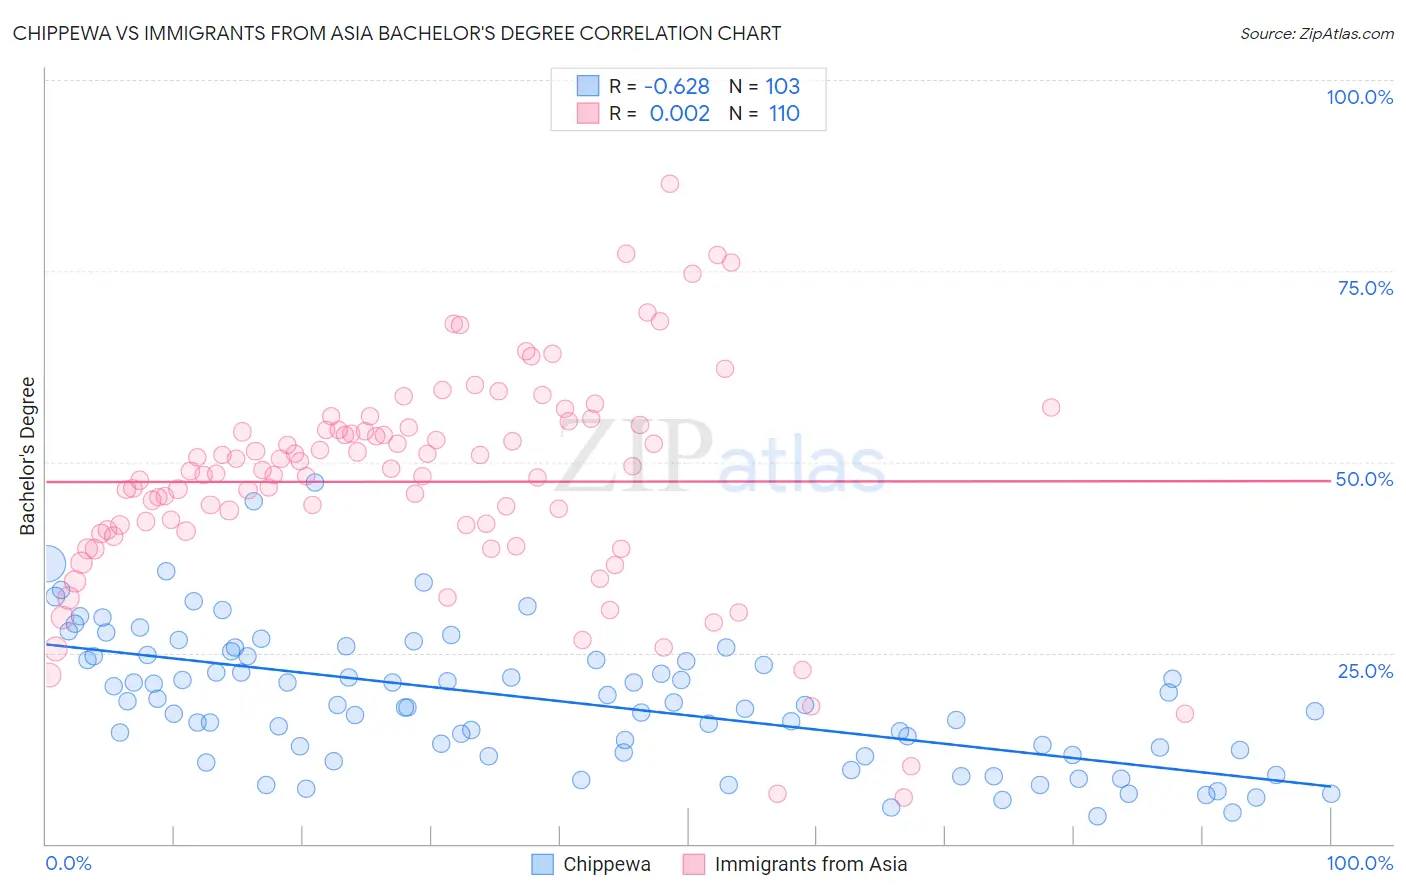
Chippewa vs Immigrants from Asia Bachelor's Degree Correlation Chart
The statistical analysis conducted on geographies consisting of 215,055,774 people shows a significant negative correlation between the proportion of Chippewa and percentage of population with at least bachelor's degree education in the United States with a correlation coefficient (R) of -0.628 and weighted average of 30.6%. Similarly, the statistical analysis conducted on geographies consisting of 549,058,309 people shows no correlation between the proportion of Immigrants from Asia and percentage of population with at least bachelor's degree education in the United States with a correlation coefficient (R) of 0.002 and weighted average of 44.3%, a difference of 45.0%.
Bachelor's Degree Correlation Summary
| Measurement | Chippewa | Immigrants from Asia |
| Minimum | 3.6% | 6.0% |
| Maximum | 47.3% | 86.4% |
| Range | 43.7% | 80.4% |
| Mean | 18.8% | 47.4% |
| Median | 18.2% | 48.6% |
| Interquartile 25% (IQ1) | 12.0% | 40.9% |
| Interquartile 75% (IQ3) | 24.6% | 54.2% |
| Interquartile Range (IQR) | 12.6% | 13.3% |
| Standard Deviation (Sample) | 8.9% | 14.2% |
| Standard Deviation (Population) | 8.8% | 14.1% |
Similar Demographics by Bachelor's Degree
Demographics Similar to Chippewa by Bachelor's Degree
In terms of bachelor's degree, the demographic groups most similar to Chippewa are Immigrants from Haiti (30.6%, a difference of 0.25%), Puget Sound Salish (30.7%, a difference of 0.31%), Immigrants from Dominican Republic (30.7%, a difference of 0.41%), Chickasaw (30.4%, a difference of 0.52%), and Immigrants from Micronesia (30.4%, a difference of 0.54%).
| Demographics | Rating | Rank | Bachelor's Degree |
| Blacks/African Americans | 0.1 /100 | #291 | Tragic 30.9% |
| Ute | 0.1 /100 | #292 | Tragic 30.9% |
| Cape Verdeans | 0.1 /100 | #293 | Tragic 30.9% |
| Immigrants | Guatemala | 0.0 /100 | #294 | Tragic 30.8% |
| Immigrants | Dominican Republic | 0.0 /100 | #295 | Tragic 30.7% |
| Puget Sound Salish | 0.0 /100 | #296 | Tragic 30.7% |
| Immigrants | Haiti | 0.0 /100 | #297 | Tragic 30.6% |
| Chippewa | 0.0 /100 | #298 | Tragic 30.6% |
| Chickasaw | 0.0 /100 | #299 | Tragic 30.4% |
| Immigrants | Micronesia | 0.0 /100 | #300 | Tragic 30.4% |
| Immigrants | Cuba | 0.0 /100 | #301 | Tragic 30.3% |
| Mexican American Indians | 0.0 /100 | #302 | Tragic 30.2% |
| Bangladeshis | 0.0 /100 | #303 | Tragic 30.2% |
| Cherokee | 0.0 /100 | #304 | Tragic 30.2% |
| Immigrants | Latin America | 0.0 /100 | #305 | Tragic 30.1% |
Demographics Similar to Immigrants from Asia by Bachelor's Degree
In terms of bachelor's degree, the demographic groups most similar to Immigrants from Asia are Immigrants from Spain (44.3%, a difference of 0.060%), Immigrants from Austria (44.2%, a difference of 0.19%), Immigrants from Bolivia (44.2%, a difference of 0.19%), Asian (44.4%, a difference of 0.24%), and Immigrants from Serbia (44.1%, a difference of 0.37%).
| Demographics | Rating | Rank | Bachelor's Degree |
| Immigrants | Bulgaria | 99.9 /100 | #46 | Exceptional 44.6% |
| Bolivians | 99.9 /100 | #47 | Exceptional 44.6% |
| Estonians | 99.9 /100 | #48 | Exceptional 44.6% |
| Immigrants | Norway | 99.9 /100 | #49 | Exceptional 44.5% |
| Immigrants | Greece | 99.9 /100 | #50 | Exceptional 44.5% |
| Asians | 99.9 /100 | #51 | Exceptional 44.4% |
| Immigrants | Spain | 99.9 /100 | #52 | Exceptional 44.3% |
| Immigrants | Asia | 99.9 /100 | #53 | Exceptional 44.3% |
| Immigrants | Austria | 99.9 /100 | #54 | Exceptional 44.2% |
| Immigrants | Bolivia | 99.9 /100 | #55 | Exceptional 44.2% |
| Immigrants | Serbia | 99.9 /100 | #56 | Exceptional 44.1% |
| Paraguayans | 99.9 /100 | #57 | Exceptional 44.0% |
| Immigrants | Czechoslovakia | 99.9 /100 | #58 | Exceptional 44.0% |
| Australians | 99.9 /100 | #59 | Exceptional 44.0% |
| New Zealanders | 99.9 /100 | #60 | Exceptional 44.0% |