Immigrants from Laos vs Argentinean GED/Equivalency
COMPARE
Immigrants from Laos
Argentinean
GED/Equivalency
GED/Equivalency Comparison
Immigrants from Laos
Argentineans
82.7%
GED/EQUIVALENCY
0.1/ 100
METRIC RATING
278th/ 347
METRIC RANK
86.7%
GED/EQUIVALENCY
89.7/ 100
METRIC RATING
127th/ 347
METRIC RANK
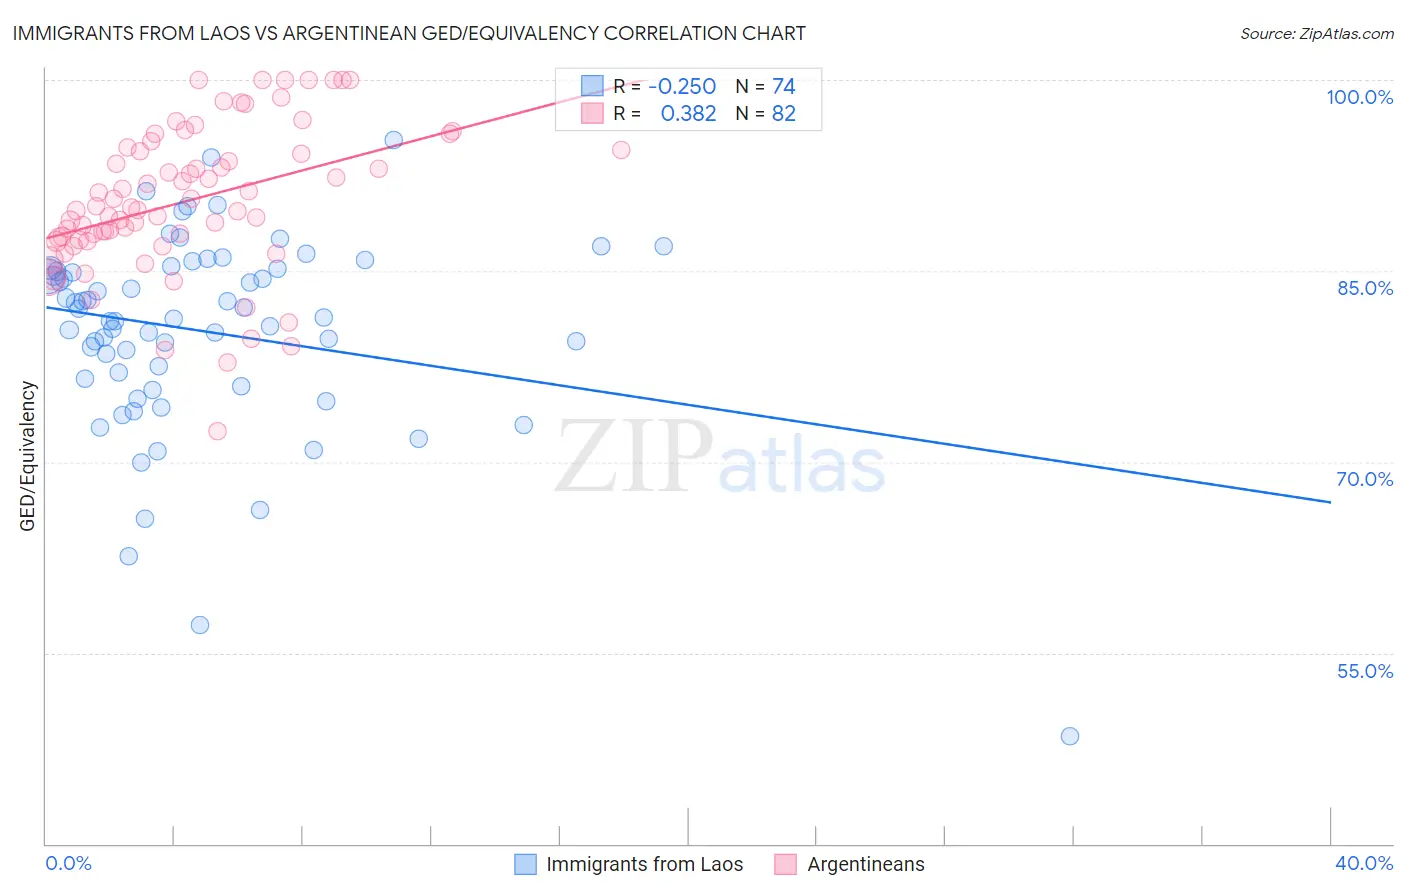
Immigrants from Laos vs Argentinean GED/Equivalency Correlation Chart
The statistical analysis conducted on geographies consisting of 201,472,886 people shows a weak negative correlation between the proportion of Immigrants from Laos and percentage of population with at least ged/equivalency education in the United States with a correlation coefficient (R) of -0.250 and weighted average of 82.7%. Similarly, the statistical analysis conducted on geographies consisting of 297,143,432 people shows a mild positive correlation between the proportion of Argentineans and percentage of population with at least ged/equivalency education in the United States with a correlation coefficient (R) of 0.382 and weighted average of 86.7%, a difference of 4.8%.
GED/Equivalency Correlation Summary
| Measurement | Immigrants from Laos | Argentinean |
| Minimum | 48.4% | 72.4% |
| Maximum | 95.3% | 100.0% |
| Range | 46.9% | 27.6% |
| Mean | 80.2% | 90.5% |
| Median | 81.3% | 89.9% |
| Interquartile 25% (IQ1) | 76.5% | 87.5% |
| Interquartile 75% (IQ3) | 85.2% | 94.5% |
| Interquartile Range (IQR) | 8.6% | 7.0% |
| Standard Deviation (Sample) | 7.9% | 5.8% |
| Standard Deviation (Population) | 7.8% | 5.7% |
Similar Demographics by GED/Equivalency
Demographics Similar to Immigrants from Laos by GED/Equivalency
In terms of ged/equivalency, the demographic groups most similar to Immigrants from Laos are Immigrants from Fiji (82.7%, a difference of 0.010%), Cheyenne (82.7%, a difference of 0.010%), Arapaho (82.8%, a difference of 0.030%), Black/African American (82.8%, a difference of 0.050%), and Seminole (82.8%, a difference of 0.070%).
| Demographics | Rating | Rank | GED/Equivalency |
| U.S. Virgin Islanders | 0.2 /100 | #271 | Tragic 82.9% |
| Barbadians | 0.1 /100 | #272 | Tragic 82.9% |
| Pennsylvania Germans | 0.1 /100 | #273 | Tragic 82.9% |
| Immigrants | Trinidad and Tobago | 0.1 /100 | #274 | Tragic 82.8% |
| Seminole | 0.1 /100 | #275 | Tragic 82.8% |
| Blacks/African Americans | 0.1 /100 | #276 | Tragic 82.8% |
| Arapaho | 0.1 /100 | #277 | Tragic 82.8% |
| Immigrants | Laos | 0.1 /100 | #278 | Tragic 82.7% |
| Immigrants | Fiji | 0.1 /100 | #279 | Tragic 82.7% |
| Cheyenne | 0.1 /100 | #280 | Tragic 82.7% |
| Sioux | 0.1 /100 | #281 | Tragic 82.6% |
| Immigrants | Immigrants | 0.1 /100 | #282 | Tragic 82.6% |
| Indonesians | 0.1 /100 | #283 | Tragic 82.5% |
| Immigrants | Barbados | 0.1 /100 | #284 | Tragic 82.4% |
| Cajuns | 0.0 /100 | #285 | Tragic 82.4% |
Demographics Similar to Argentineans by GED/Equivalency
In terms of ged/equivalency, the demographic groups most similar to Argentineans are Yugoslavian (86.7%, a difference of 0.010%), Asian (86.7%, a difference of 0.030%), Immigrants from Egypt (86.7%, a difference of 0.040%), Celtic (86.7%, a difference of 0.040%), and Immigrants from Ukraine (86.7%, a difference of 0.040%).
| Demographics | Rating | Rank | GED/Equivalency |
| Scotch-Irish | 91.6 /100 | #120 | Exceptional 86.8% |
| Immigrants | Lebanon | 90.9 /100 | #121 | Exceptional 86.8% |
| Immigrants | Jordan | 90.8 /100 | #122 | Exceptional 86.8% |
| Immigrants | Italy | 90.5 /100 | #123 | Exceptional 86.7% |
| Immigrants | Egypt | 90.4 /100 | #124 | Exceptional 86.7% |
| Celtics | 90.4 /100 | #125 | Exceptional 86.7% |
| Asians | 90.3 /100 | #126 | Exceptional 86.7% |
| Argentineans | 89.7 /100 | #127 | Excellent 86.7% |
| Yugoslavians | 89.5 /100 | #128 | Excellent 86.7% |
| Immigrants | Ukraine | 88.9 /100 | #129 | Excellent 86.7% |
| Immigrants | Germany | 88.8 /100 | #130 | Excellent 86.7% |
| Immigrants | Spain | 88.5 /100 | #131 | Excellent 86.7% |
| Immigrants | Brazil | 88.4 /100 | #132 | Excellent 86.6% |
| Tsimshian | 88.3 /100 | #133 | Excellent 86.6% |
| Albanians | 87.7 /100 | #134 | Excellent 86.6% |