Chippewa vs Barbadian GED/Equivalency
COMPARE
Chippewa
Barbadian
GED/Equivalency
GED/Equivalency Comparison
Chippewa
Barbadians
85.2%
GED/EQUIVALENCY
20.8/ 100
METRIC RATING
195th/ 347
METRIC RANK
82.9%
GED/EQUIVALENCY
0.1/ 100
METRIC RATING
272nd/ 347
METRIC RANK
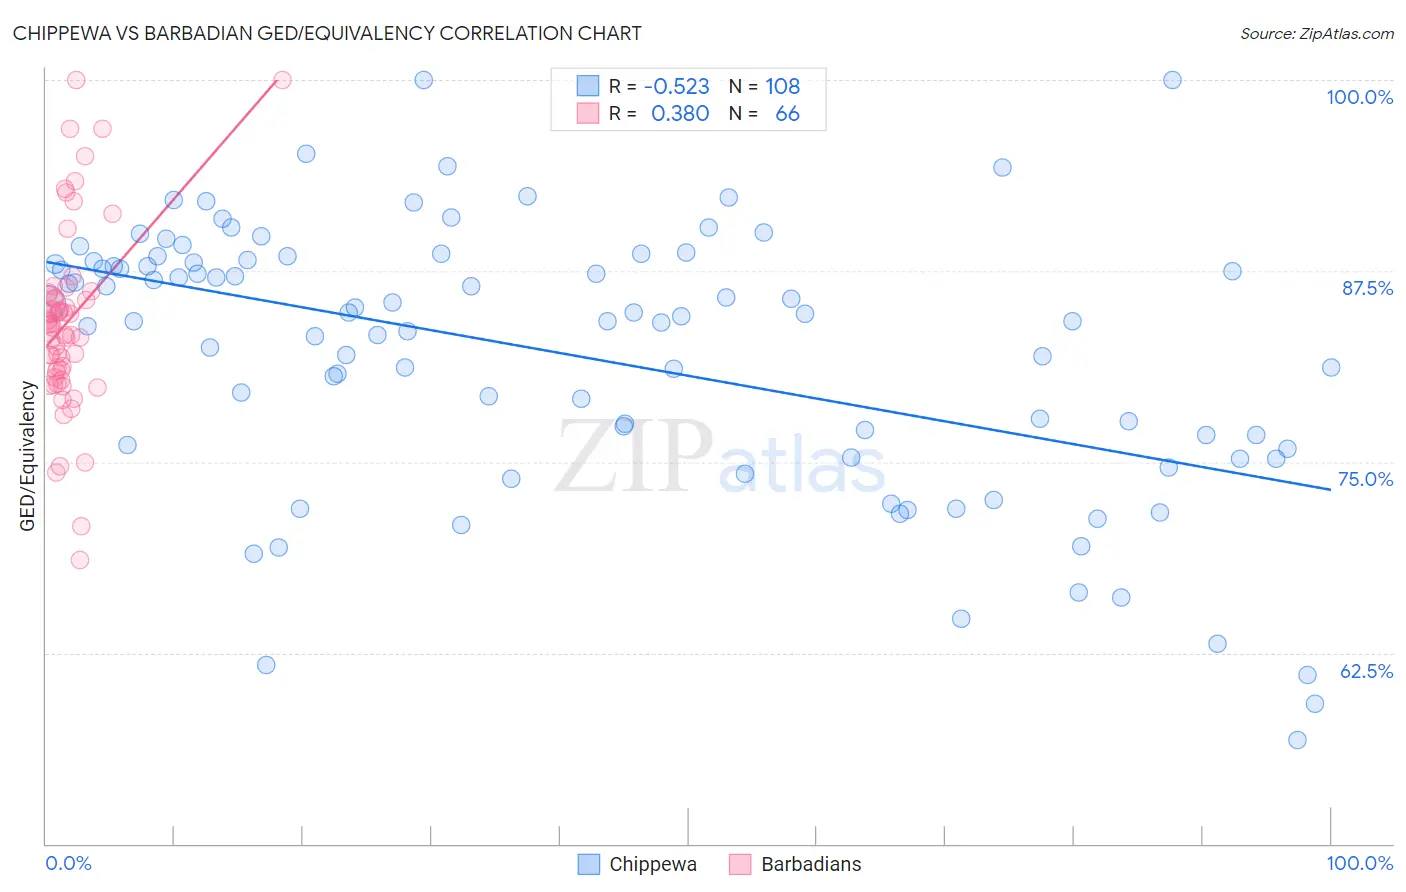
Chippewa vs Barbadian GED/Equivalency Correlation Chart
The statistical analysis conducted on geographies consisting of 215,068,282 people shows a substantial negative correlation between the proportion of Chippewa and percentage of population with at least ged/equivalency education in the United States with a correlation coefficient (R) of -0.523 and weighted average of 85.2%. Similarly, the statistical analysis conducted on geographies consisting of 141,302,824 people shows a mild positive correlation between the proportion of Barbadians and percentage of population with at least ged/equivalency education in the United States with a correlation coefficient (R) of 0.380 and weighted average of 82.9%, a difference of 2.8%.
GED/Equivalency Correlation Summary
| Measurement | Chippewa | Barbadian |
| Minimum | 56.8% | 68.6% |
| Maximum | 100.0% | 100.0% |
| Range | 43.2% | 31.4% |
| Mean | 82.0% | 84.2% |
| Median | 84.4% | 83.9% |
| Interquartile 25% (IQ1) | 76.0% | 80.9% |
| Interquartile 75% (IQ3) | 88.1% | 85.9% |
| Interquartile Range (IQR) | 12.1% | 5.0% |
| Standard Deviation (Sample) | 8.8% | 6.0% |
| Standard Deviation (Population) | 8.8% | 6.0% |
Similar Demographics by GED/Equivalency
Demographics Similar to Chippewa by GED/Equivalency
In terms of ged/equivalency, the demographic groups most similar to Chippewa are Puget Sound Salish (85.2%, a difference of 0.0%), Tongan (85.2%, a difference of 0.0%), Costa Rican (85.2%, a difference of 0.010%), Delaware (85.2%, a difference of 0.040%), and South American Indian (85.2%, a difference of 0.060%).
| Demographics | Rating | Rank | GED/Equivalency |
| Immigrants | Sierra Leone | 29.0 /100 | #188 | Fair 85.4% |
| Guamanians/Chamorros | 28.4 /100 | #189 | Fair 85.3% |
| Alaskan Athabascans | 27.5 /100 | #190 | Fair 85.3% |
| South American Indians | 22.8 /100 | #191 | Fair 85.2% |
| Immigrants | Nonimmigrants | 22.7 /100 | #192 | Fair 85.2% |
| Delaware | 22.2 /100 | #193 | Fair 85.2% |
| Puget Sound Salish | 20.8 /100 | #194 | Fair 85.2% |
| Chippewa | 20.8 /100 | #195 | Fair 85.2% |
| Tongans | 20.7 /100 | #196 | Fair 85.2% |
| Costa Ricans | 20.4 /100 | #197 | Fair 85.2% |
| Immigrants | Africa | 17.5 /100 | #198 | Poor 85.1% |
| Somalis | 16.4 /100 | #199 | Poor 85.0% |
| Uruguayans | 16.0 /100 | #200 | Poor 85.0% |
| Portuguese | 15.9 /100 | #201 | Poor 85.0% |
| Cree | 15.9 /100 | #202 | Poor 85.0% |
Demographics Similar to Barbadians by GED/Equivalency
In terms of ged/equivalency, the demographic groups most similar to Barbadians are Pennsylvania German (82.9%, a difference of 0.010%), Immigrants from Trinidad and Tobago (82.8%, a difference of 0.020%), U.S. Virgin Islander (82.9%, a difference of 0.040%), Immigrants from Jamaica (82.9%, a difference of 0.080%), and Seminole (82.8%, a difference of 0.090%).
| Demographics | Rating | Rank | GED/Equivalency |
| West Indians | 0.2 /100 | #265 | Tragic 83.1% |
| Kiowa | 0.2 /100 | #266 | Tragic 83.1% |
| Trinidadians and Tobagonians | 0.2 /100 | #267 | Tragic 83.0% |
| Immigrants | Burma/Myanmar | 0.2 /100 | #268 | Tragic 83.0% |
| Hopi | 0.2 /100 | #269 | Tragic 83.0% |
| Immigrants | Jamaica | 0.2 /100 | #270 | Tragic 82.9% |
| U.S. Virgin Islanders | 0.2 /100 | #271 | Tragic 82.9% |
| Barbadians | 0.1 /100 | #272 | Tragic 82.9% |
| Pennsylvania Germans | 0.1 /100 | #273 | Tragic 82.9% |
| Immigrants | Trinidad and Tobago | 0.1 /100 | #274 | Tragic 82.8% |
| Seminole | 0.1 /100 | #275 | Tragic 82.8% |
| Blacks/African Americans | 0.1 /100 | #276 | Tragic 82.8% |
| Arapaho | 0.1 /100 | #277 | Tragic 82.8% |
| Immigrants | Laos | 0.1 /100 | #278 | Tragic 82.7% |
| Immigrants | Fiji | 0.1 /100 | #279 | Tragic 82.7% |