Chinese vs Immigrants from Bosnia and Herzegovina Associate's Degree
COMPARE
Chinese
Immigrants from Bosnia and Herzegovina
Associate's Degree
Associate's Degree Comparison
Chinese
Immigrants from Bosnia and Herzegovina
48.5%
ASSOCIATE'S DEGREE
92.5/ 100
METRIC RATING
125th/ 347
METRIC RANK
46.3%
ASSOCIATE'S DEGREE
48.3/ 100
METRIC RATING
178th/ 347
METRIC RANK
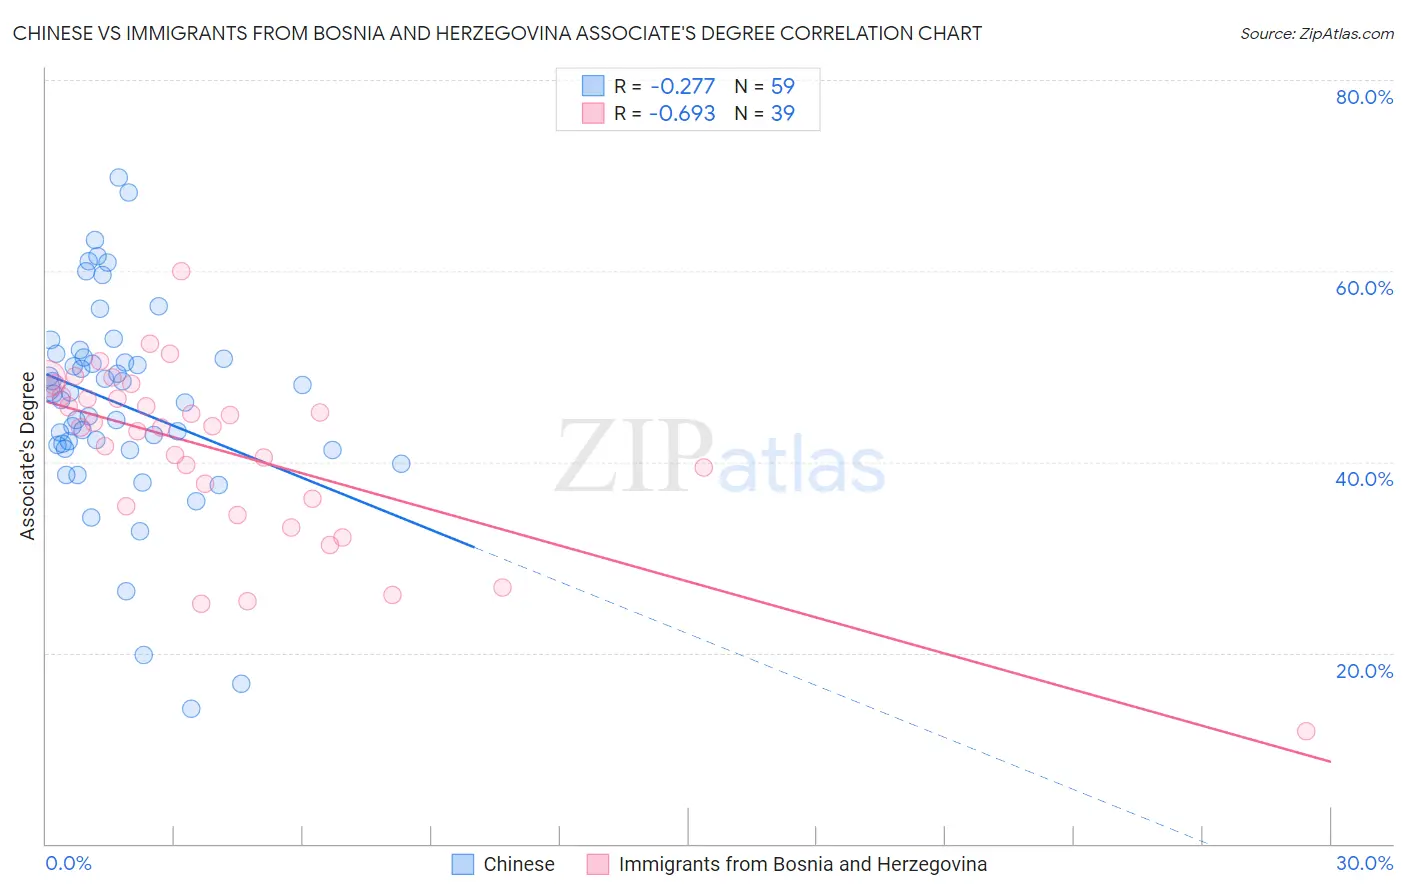
Chinese vs Immigrants from Bosnia and Herzegovina Associate's Degree Correlation Chart
The statistical analysis conducted on geographies consisting of 64,809,883 people shows a weak negative correlation between the proportion of Chinese and percentage of population with at least associate's degree education in the United States with a correlation coefficient (R) of -0.277 and weighted average of 48.5%. Similarly, the statistical analysis conducted on geographies consisting of 156,817,312 people shows a significant negative correlation between the proportion of Immigrants from Bosnia and Herzegovina and percentage of population with at least associate's degree education in the United States with a correlation coefficient (R) of -0.693 and weighted average of 46.3%, a difference of 4.8%.
Associate's Degree Correlation Summary
| Measurement | Chinese | Immigrants from Bosnia and Herzegovina |
| Minimum | 14.2% | 11.8% |
| Maximum | 69.8% | 59.9% |
| Range | 55.6% | 48.2% |
| Mean | 46.1% | 41.0% |
| Median | 47.1% | 43.6% |
| Interquartile 25% (IQ1) | 41.4% | 35.3% |
| Interquartile 75% (IQ3) | 50.9% | 46.9% |
| Interquartile Range (IQR) | 9.5% | 11.5% |
| Standard Deviation (Sample) | 10.8% | 9.4% |
| Standard Deviation (Population) | 10.7% | 9.2% |
Similar Demographics by Associate's Degree
Demographics Similar to Chinese by Associate's Degree
In terms of associate's degree, the demographic groups most similar to Chinese are Serbian (48.5%, a difference of 0.020%), Immigrants from Syria (48.5%, a difference of 0.090%), Immigrants from Uganda (48.5%, a difference of 0.10%), Immigrants from Eastern Africa (48.4%, a difference of 0.22%), and Swedish (48.4%, a difference of 0.25%).
| Demographics | Rating | Rank | Associate's Degree |
| Albanians | 94.7 /100 | #118 | Exceptional 48.8% |
| Lebanese | 94.6 /100 | #119 | Exceptional 48.8% |
| Alsatians | 94.6 /100 | #120 | Exceptional 48.8% |
| Ugandans | 93.9 /100 | #121 | Exceptional 48.7% |
| Italians | 93.9 /100 | #122 | Exceptional 48.7% |
| Brazilians | 93.7 /100 | #123 | Exceptional 48.7% |
| Serbians | 92.6 /100 | #124 | Exceptional 48.5% |
| Chinese | 92.5 /100 | #125 | Exceptional 48.5% |
| Immigrants | Syria | 92.2 /100 | #126 | Exceptional 48.5% |
| Immigrants | Uganda | 92.1 /100 | #127 | Exceptional 48.5% |
| Immigrants | Eastern Africa | 91.6 /100 | #128 | Exceptional 48.4% |
| Swedes | 91.5 /100 | #129 | Exceptional 48.4% |
| Immigrants | Jordan | 91.2 /100 | #130 | Exceptional 48.4% |
| Icelanders | 90.8 /100 | #131 | Exceptional 48.3% |
| Immigrants | Albania | 89.9 /100 | #132 | Excellent 48.2% |
Demographics Similar to Immigrants from Bosnia and Herzegovina by Associate's Degree
In terms of associate's degree, the demographic groups most similar to Immigrants from Bosnia and Herzegovina are Slovak (46.3%, a difference of 0.010%), Finnish (46.3%, a difference of 0.020%), Belgian (46.3%, a difference of 0.040%), Sri Lankan (46.3%, a difference of 0.050%), and English (46.4%, a difference of 0.13%).
| Demographics | Rating | Rank | Associate's Degree |
| Basques | 52.8 /100 | #171 | Average 46.5% |
| Peruvians | 50.5 /100 | #172 | Average 46.4% |
| Immigrants | Iraq | 50.3 /100 | #173 | Average 46.4% |
| English | 50.0 /100 | #174 | Average 46.4% |
| Belgians | 48.9 /100 | #175 | Average 46.3% |
| Finns | 48.5 /100 | #176 | Average 46.3% |
| Slovaks | 48.4 /100 | #177 | Average 46.3% |
| Immigrants | Bosnia and Herzegovina | 48.3 /100 | #178 | Average 46.3% |
| Sri Lankans | 47.6 /100 | #179 | Average 46.3% |
| Bermudans | 46.4 /100 | #180 | Average 46.2% |
| Immigrants | Colombia | 41.3 /100 | #181 | Average 46.0% |
| Swiss | 40.4 /100 | #182 | Average 46.0% |
| Yugoslavians | 40.2 /100 | #183 | Average 46.0% |
| Czechoslovakians | 40.0 /100 | #184 | Average 46.0% |
| Costa Ricans | 38.6 /100 | #185 | Fair 46.0% |