Chilean vs Immigrants from Cuba Poverty
COMPARE
Chilean
Immigrants from Cuba
Poverty
Poverty Comparison
Chileans
Immigrants from Cuba
11.8%
POVERTY
84.2/ 100
METRIC RATING
136th/ 347
METRIC RANK
14.6%
POVERTY
0.1/ 100
METRIC RATING
269th/ 347
METRIC RANK
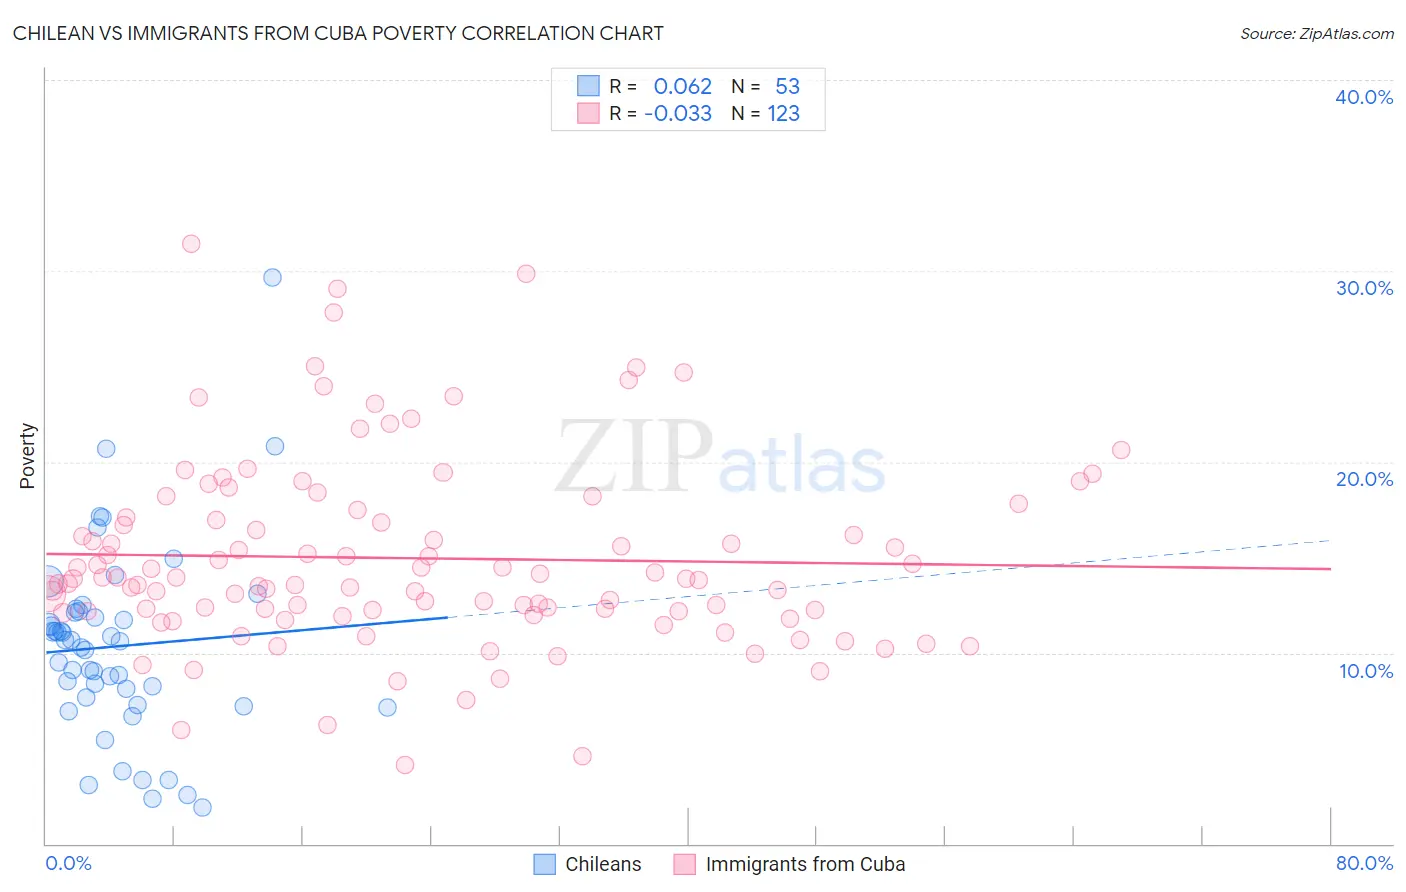
Chilean vs Immigrants from Cuba Poverty Correlation Chart
The statistical analysis conducted on geographies consisting of 256,580,078 people shows a slight positive correlation between the proportion of Chileans and poverty level in the United States with a correlation coefficient (R) of 0.062 and weighted average of 11.8%. Similarly, the statistical analysis conducted on geographies consisting of 325,967,480 people shows no correlation between the proportion of Immigrants from Cuba and poverty level in the United States with a correlation coefficient (R) of -0.033 and weighted average of 14.6%, a difference of 23.2%.
Poverty Correlation Summary
| Measurement | Chilean | Immigrants from Cuba |
| Minimum | 1.9% | 4.1% |
| Maximum | 29.7% | 31.4% |
| Range | 27.8% | 27.3% |
| Mean | 10.3% | 15.0% |
| Median | 10.6% | 13.9% |
| Interquartile 25% (IQ1) | 7.5% | 12.2% |
| Interquartile 75% (IQ3) | 12.1% | 17.1% |
| Interquartile Range (IQR) | 4.7% | 4.9% |
| Standard Deviation (Sample) | 5.0% | 5.0% |
| Standard Deviation (Population) | 5.0% | 5.0% |
Similar Demographics by Poverty
Demographics Similar to Chileans by Poverty
In terms of poverty, the demographic groups most similar to Chileans are Immigrants from Vietnam (11.8%, a difference of 0.19%), Yugoslavian (11.8%, a difference of 0.20%), Immigrants from Western Europe (11.8%, a difference of 0.21%), Immigrants from Switzerland (11.8%, a difference of 0.21%), and Peruvian (11.8%, a difference of 0.29%).
| Demographics | Rating | Rank | Poverty |
| South Africans | 87.0 /100 | #129 | Excellent 11.7% |
| Immigrants | Ukraine | 86.6 /100 | #130 | Excellent 11.8% |
| French | 86.1 /100 | #131 | Excellent 11.8% |
| Peruvians | 85.6 /100 | #132 | Excellent 11.8% |
| Immigrants | Western Europe | 85.2 /100 | #133 | Excellent 11.8% |
| Yugoslavians | 85.2 /100 | #134 | Excellent 11.8% |
| Immigrants | Vietnam | 85.2 /100 | #135 | Excellent 11.8% |
| Chileans | 84.2 /100 | #136 | Excellent 11.8% |
| Immigrants | Switzerland | 83.0 /100 | #137 | Excellent 11.8% |
| Immigrants | Jordan | 82.4 /100 | #138 | Excellent 11.9% |
| Pakistanis | 82.2 /100 | #139 | Excellent 11.9% |
| Immigrants | Peru | 81.1 /100 | #140 | Excellent 11.9% |
| Immigrants | France | 80.5 /100 | #141 | Excellent 11.9% |
| Basques | 80.4 /100 | #142 | Excellent 11.9% |
| Brazilians | 79.7 /100 | #143 | Good 11.9% |
Demographics Similar to Immigrants from Cuba by Poverty
In terms of poverty, the demographic groups most similar to Immigrants from Cuba are Central American (14.6%, a difference of 0.14%), Subsaharan African (14.5%, a difference of 0.15%), Iroquois (14.5%, a difference of 0.19%), Guyanese (14.5%, a difference of 0.51%), and Immigrants from Guyana (14.5%, a difference of 0.68%).
| Demographics | Rating | Rank | Poverty |
| Immigrants | Liberia | 0.1 /100 | #262 | Tragic 14.4% |
| Jamaicans | 0.1 /100 | #263 | Tragic 14.4% |
| Immigrants | Jamaica | 0.1 /100 | #264 | Tragic 14.4% |
| Immigrants | Guyana | 0.1 /100 | #265 | Tragic 14.5% |
| Guyanese | 0.1 /100 | #266 | Tragic 14.5% |
| Iroquois | 0.1 /100 | #267 | Tragic 14.5% |
| Sub-Saharan Africans | 0.1 /100 | #268 | Tragic 14.5% |
| Immigrants | Cuba | 0.1 /100 | #269 | Tragic 14.6% |
| Central Americans | 0.1 /100 | #270 | Tragic 14.6% |
| Shoshone | 0.0 /100 | #271 | Tragic 14.7% |
| Chickasaw | 0.0 /100 | #272 | Tragic 14.7% |
| Spanish Americans | 0.0 /100 | #273 | Tragic 14.7% |
| Barbadians | 0.0 /100 | #274 | Tragic 14.8% |
| Immigrants | West Indies | 0.0 /100 | #275 | Tragic 14.8% |
| Immigrants | Bahamas | 0.0 /100 | #276 | Tragic 14.8% |