Chilean vs Immigrants from Iran College, 1 year or more
COMPARE
Chilean
Immigrants from Iran
College, 1 year or more
College, 1 year or more Comparison
Chileans
Immigrants from Iran
62.0%
COLLEGE, 1 YEAR OR MORE
96.4/ 100
METRIC RATING
104th/ 347
METRIC RANK
69.5%
COLLEGE, 1 YEAR OR MORE
100.0/ 100
METRIC RATING
6th/ 347
METRIC RANK
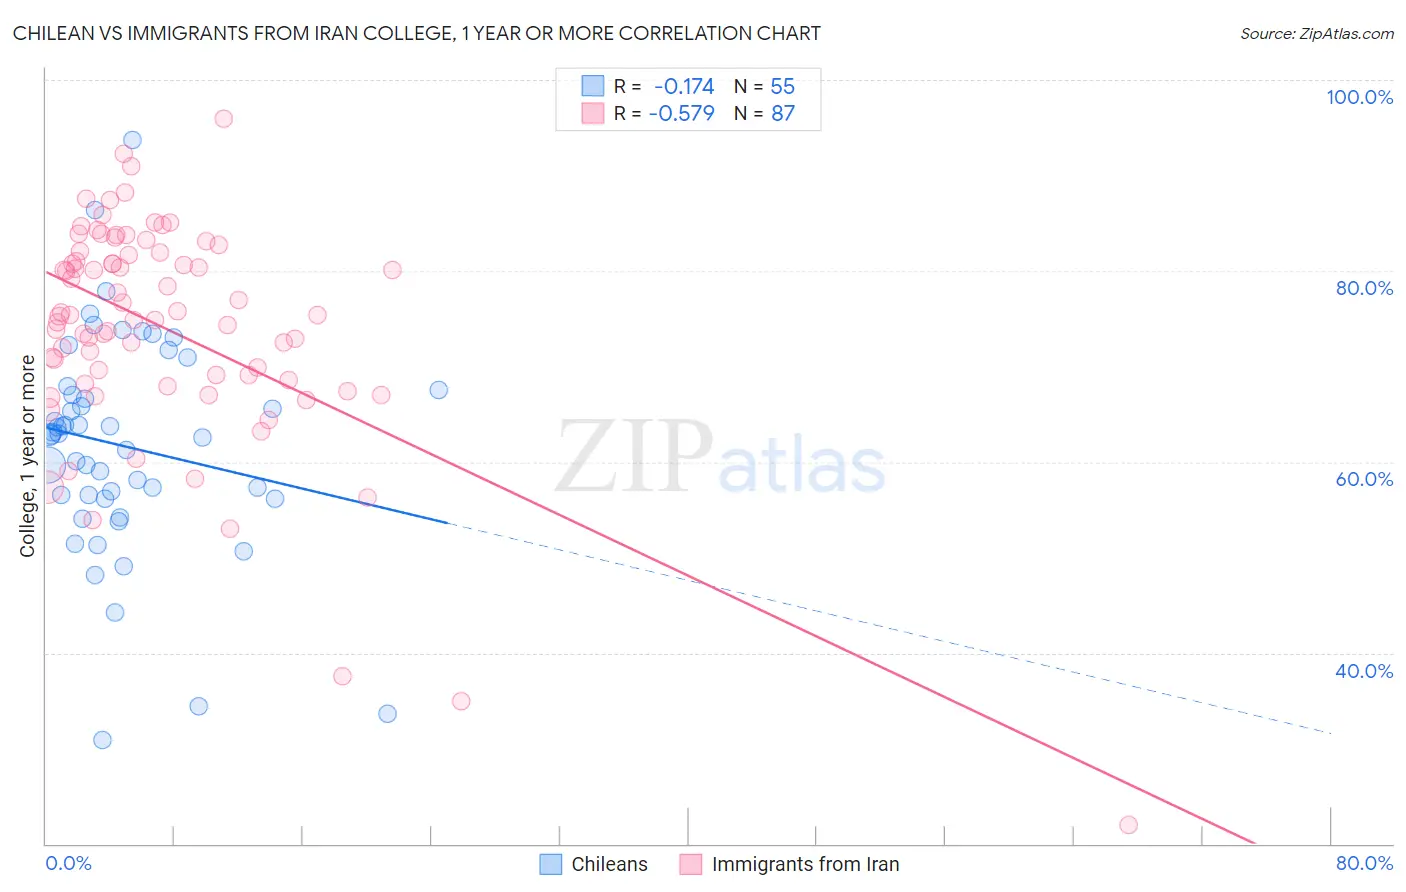
Chilean vs Immigrants from Iran College, 1 year or more Correlation Chart
The statistical analysis conducted on geographies consisting of 256,684,337 people shows a poor negative correlation between the proportion of Chileans and percentage of population with at least college, 1 year or more education in the United States with a correlation coefficient (R) of -0.174 and weighted average of 62.0%. Similarly, the statistical analysis conducted on geographies consisting of 279,905,207 people shows a substantial negative correlation between the proportion of Immigrants from Iran and percentage of population with at least college, 1 year or more education in the United States with a correlation coefficient (R) of -0.579 and weighted average of 69.5%, a difference of 12.1%.
College, 1 year or more Correlation Summary
| Measurement | Chilean | Immigrants from Iran |
| Minimum | 30.9% | 22.0% |
| Maximum | 93.7% | 96.0% |
| Range | 62.8% | 74.0% |
| Mean | 61.6% | 74.0% |
| Median | 62.9% | 75.3% |
| Interquartile 25% (IQ1) | 56.2% | 68.5% |
| Interquartile 75% (IQ3) | 67.5% | 82.0% |
| Interquartile Range (IQR) | 11.3% | 13.4% |
| Standard Deviation (Sample) | 11.5% | 12.0% |
| Standard Deviation (Population) | 11.4% | 11.9% |
Similar Demographics by College, 1 year or more
Demographics Similar to Chileans by College, 1 year or more
In terms of college, 1 year or more, the demographic groups most similar to Chileans are Afghan (62.0%, a difference of 0.010%), Immigrants from Nepal (62.0%, a difference of 0.020%), Palestinian (62.0%, a difference of 0.020%), Luxembourger (62.1%, a difference of 0.13%), and Swedish (62.1%, a difference of 0.14%).
| Demographics | Rating | Rank | College, 1 year or more |
| Jordanians | 97.2 /100 | #97 | Exceptional 62.2% |
| Carpatho Rusyns | 97.2 /100 | #98 | Exceptional 62.2% |
| Croatians | 97.1 /100 | #99 | Exceptional 62.2% |
| Icelanders | 96.8 /100 | #100 | Exceptional 62.1% |
| Swedes | 96.8 /100 | #101 | Exceptional 62.1% |
| Luxembourgers | 96.7 /100 | #102 | Exceptional 62.1% |
| Afghans | 96.4 /100 | #103 | Exceptional 62.0% |
| Chileans | 96.4 /100 | #104 | Exceptional 62.0% |
| Immigrants | Nepal | 96.3 /100 | #105 | Exceptional 62.0% |
| Palestinians | 96.3 /100 | #106 | Exceptional 62.0% |
| Immigrants | Ukraine | 95.8 /100 | #107 | Exceptional 61.9% |
| Syrians | 95.7 /100 | #108 | Exceptional 61.9% |
| Immigrants | Northern Africa | 95.7 /100 | #109 | Exceptional 61.9% |
| Europeans | 95.6 /100 | #110 | Exceptional 61.8% |
| Macedonians | 95.6 /100 | #111 | Exceptional 61.8% |
Demographics Similar to Immigrants from Iran by College, 1 year or more
In terms of college, 1 year or more, the demographic groups most similar to Immigrants from Iran are Immigrants from Taiwan (69.6%, a difference of 0.20%), Immigrants from India (69.6%, a difference of 0.20%), Iranian (70.0%, a difference of 0.70%), Okinawan (69.0%, a difference of 0.77%), and Immigrants from Singapore (70.1%, a difference of 0.92%).
| Demographics | Rating | Rank | College, 1 year or more |
| Filipinos | 100.0 /100 | #1 | Exceptional 71.0% |
| Immigrants | Singapore | 100.0 /100 | #2 | Exceptional 70.1% |
| Iranians | 100.0 /100 | #3 | Exceptional 70.0% |
| Immigrants | Taiwan | 100.0 /100 | #4 | Exceptional 69.6% |
| Immigrants | India | 100.0 /100 | #5 | Exceptional 69.6% |
| Immigrants | Iran | 100.0 /100 | #6 | Exceptional 69.5% |
| Okinawans | 100.0 /100 | #7 | Exceptional 69.0% |
| Thais | 100.0 /100 | #8 | Exceptional 68.6% |
| Immigrants | Israel | 100.0 /100 | #9 | Exceptional 67.8% |
| Immigrants | Australia | 100.0 /100 | #10 | Exceptional 67.7% |
| Immigrants | South Central Asia | 100.0 /100 | #11 | Exceptional 67.1% |
| Cypriots | 100.0 /100 | #12 | Exceptional 67.0% |
| Immigrants | Sweden | 100.0 /100 | #13 | Exceptional 66.8% |
| Burmese | 100.0 /100 | #14 | Exceptional 66.7% |
| Cambodians | 100.0 /100 | #15 | Exceptional 66.7% |