Chilean vs American Unemployment
COMPARE
Chilean
American
Unemployment
Unemployment Comparison
Chileans
Americans
5.0%
UNEMPLOYMENT
93.2/ 100
METRIC RATING
111th/ 347
METRIC RANK
5.0%
UNEMPLOYMENT
94.3/ 100
METRIC RATING
101st/ 347
METRIC RANK
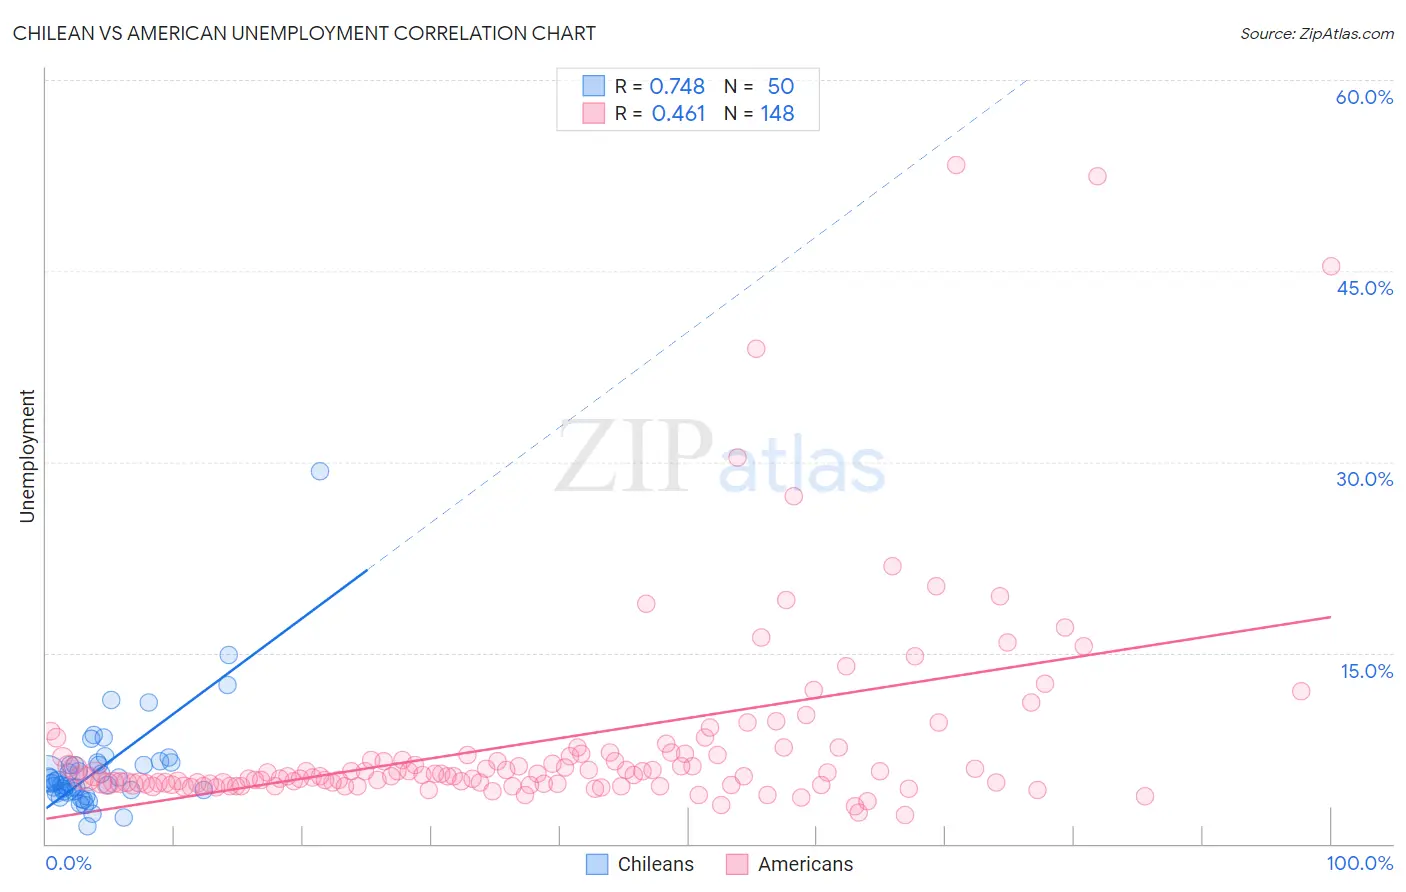
Chilean vs American Unemployment Correlation Chart
The statistical analysis conducted on geographies consisting of 256,557,466 people shows a strong positive correlation between the proportion of Chileans and unemployment in the United States with a correlation coefficient (R) of 0.748 and weighted average of 5.0%. Similarly, the statistical analysis conducted on geographies consisting of 576,683,680 people shows a moderate positive correlation between the proportion of Americans and unemployment in the United States with a correlation coefficient (R) of 0.461 and weighted average of 5.0%, a difference of 0.29%.
Unemployment Correlation Summary
| Measurement | Chilean | American |
| Minimum | 1.4% | 2.2% |
| Maximum | 29.3% | 53.3% |
| Range | 27.9% | 51.1% |
| Mean | 6.0% | 8.0% |
| Median | 5.0% | 5.4% |
| Interquartile 25% (IQ1) | 4.1% | 4.7% |
| Interquartile 75% (IQ3) | 6.4% | 7.0% |
| Interquartile Range (IQR) | 2.3% | 2.3% |
| Standard Deviation (Sample) | 4.2% | 8.0% |
| Standard Deviation (Population) | 4.2% | 8.0% |
Demographics Similar to Chileans and Americans by Unemployment
In terms of unemployment, the demographic groups most similar to Chileans are Immigrants from Lithuania (5.0%, a difference of 0.0%), Immigrants from Eritrea (5.0%, a difference of 0.020%), Immigrants from Kuwait (5.0%, a difference of 0.12%), Immigrants from Turkey (5.0%, a difference of 0.13%), and Immigrants from Romania (5.0%, a difference of 0.14%). Similarly, the demographic groups most similar to Americans are Immigrants from Argentina (5.0%, a difference of 0.050%), Chickasaw (5.0%, a difference of 0.080%), Osage (5.0%, a difference of 0.080%), Maltese (5.0%, a difference of 0.090%), and Estonian (5.0%, a difference of 0.10%).
| Demographics | Rating | Rank | Unemployment |
| Immigrants | England | 95.2 /100 | #96 | Exceptional 5.0% |
| Immigrants | Czechoslovakia | 95.1 /100 | #97 | Exceptional 5.0% |
| Romanians | 95.0 /100 | #98 | Exceptional 5.0% |
| Mongolians | 94.8 /100 | #99 | Exceptional 5.0% |
| Estonians | 94.6 /100 | #100 | Exceptional 5.0% |
| Americans | 94.3 /100 | #101 | Exceptional 5.0% |
| Immigrants | Argentina | 94.1 /100 | #102 | Exceptional 5.0% |
| Chickasaw | 94.0 /100 | #103 | Exceptional 5.0% |
| Osage | 94.0 /100 | #104 | Exceptional 5.0% |
| Maltese | 94.0 /100 | #105 | Exceptional 5.0% |
| Immigrants | Romania | 93.7 /100 | #106 | Exceptional 5.0% |
| Immigrants | Turkey | 93.7 /100 | #107 | Exceptional 5.0% |
| Immigrants | Kuwait | 93.7 /100 | #108 | Exceptional 5.0% |
| Immigrants | Eritrea | 93.3 /100 | #109 | Exceptional 5.0% |
| Immigrants | Lithuania | 93.2 /100 | #110 | Exceptional 5.0% |
| Chileans | 93.2 /100 | #111 | Exceptional 5.0% |
| South Africans | 92.6 /100 | #112 | Exceptional 5.1% |
| Argentineans | 92.4 /100 | #113 | Exceptional 5.1% |
| Immigrants | Ireland | 92.1 /100 | #114 | Exceptional 5.1% |
| Immigrants | Western Europe | 91.1 /100 | #115 | Exceptional 5.1% |
| Immigrants | Sri Lanka | 91.1 /100 | #116 | Exceptional 5.1% |