Chickasaw vs South African Master's Degree
COMPARE
Chickasaw
South African
Master's Degree
Master's Degree Comparison
Chickasaw
South Africans
11.4%
MASTER'S DEGREE
0.1/ 100
METRIC RATING
299th/ 347
METRIC RANK
18.1%
MASTER'S DEGREE
99.9/ 100
METRIC RATING
64th/ 347
METRIC RANK
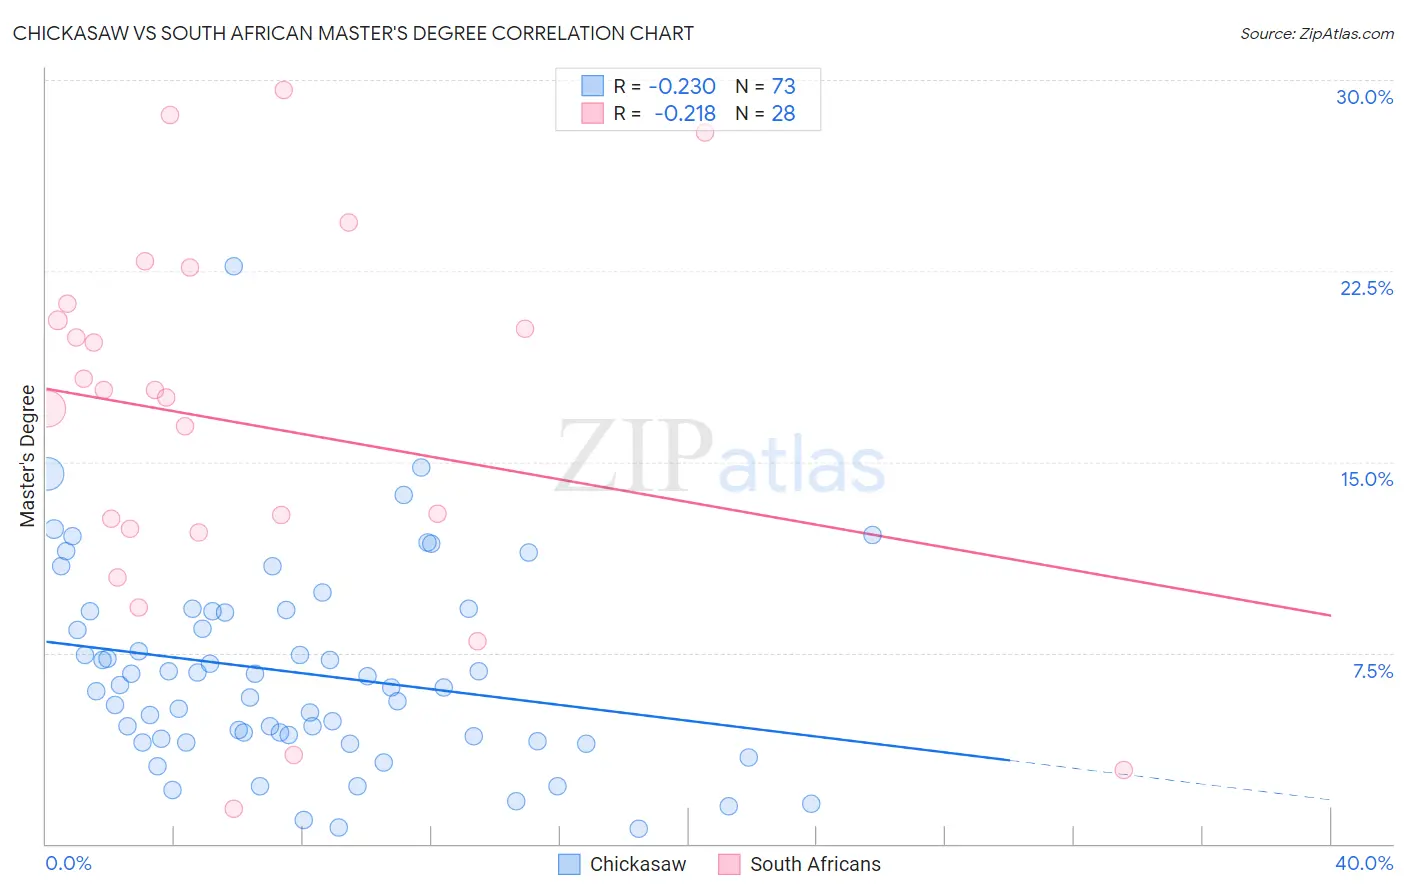
Chickasaw vs South African Master's Degree Correlation Chart
The statistical analysis conducted on geographies consisting of 147,685,526 people shows a weak negative correlation between the proportion of Chickasaw and percentage of population with at least master's degree education in the United States with a correlation coefficient (R) of -0.230 and weighted average of 11.4%. Similarly, the statistical analysis conducted on geographies consisting of 182,576,527 people shows a weak negative correlation between the proportion of South Africans and percentage of population with at least master's degree education in the United States with a correlation coefficient (R) of -0.218 and weighted average of 18.1%, a difference of 58.5%.
Master's Degree Correlation Summary
| Measurement | Chickasaw | South African |
| Minimum | 0.60% | 1.4% |
| Maximum | 22.7% | 29.6% |
| Range | 22.1% | 28.2% |
| Mean | 6.7% | 16.5% |
| Median | 6.1% | 17.7% |
| Interquartile 25% (IQ1) | 4.1% | 12.3% |
| Interquartile 75% (IQ3) | 9.1% | 20.9% |
| Interquartile Range (IQR) | 5.1% | 8.6% |
| Standard Deviation (Sample) | 3.9% | 7.4% |
| Standard Deviation (Population) | 3.9% | 7.3% |
Similar Demographics by Master's Degree
Demographics Similar to Chickasaw by Master's Degree
In terms of master's degree, the demographic groups most similar to Chickasaw are Chippewa (11.4%, a difference of 0.020%), Tsimshian (11.4%, a difference of 0.18%), Samoan (11.5%, a difference of 0.46%), Cherokee (11.4%, a difference of 0.49%), and Immigrants from Laos (11.4%, a difference of 0.51%).
| Demographics | Rating | Rank | Master's Degree |
| Immigrants | Guatemala | 0.1 /100 | #292 | Tragic 11.6% |
| Alaska Natives | 0.1 /100 | #293 | Tragic 11.6% |
| Hawaiians | 0.1 /100 | #294 | Tragic 11.6% |
| Marshallese | 0.1 /100 | #295 | Tragic 11.6% |
| Alaskan Athabascans | 0.1 /100 | #296 | Tragic 11.6% |
| Immigrants | Yemen | 0.1 /100 | #297 | Tragic 11.6% |
| Samoans | 0.1 /100 | #298 | Tragic 11.5% |
| Chickasaw | 0.1 /100 | #299 | Tragic 11.4% |
| Chippewa | 0.1 /100 | #300 | Tragic 11.4% |
| Tsimshian | 0.1 /100 | #301 | Tragic 11.4% |
| Cherokee | 0.1 /100 | #302 | Tragic 11.4% |
| Immigrants | Laos | 0.1 /100 | #303 | Tragic 11.4% |
| Immigrants | Cabo Verde | 0.1 /100 | #304 | Tragic 11.3% |
| Immigrants | Latin America | 0.0 /100 | #305 | Tragic 11.3% |
| Mexican American Indians | 0.0 /100 | #306 | Tragic 11.2% |
Demographics Similar to South Africans by Master's Degree
In terms of master's degree, the demographic groups most similar to South Africans are Immigrants from Netherlands (18.1%, a difference of 0.080%), Argentinean (18.2%, a difference of 0.44%), Immigrants from Kazakhstan (18.0%, a difference of 0.70%), Ethiopian (18.0%, a difference of 0.73%), and Immigrants from Argentina (18.0%, a difference of 0.78%).
| Demographics | Rating | Rank | Master's Degree |
| Immigrants | Asia | 99.9 /100 | #57 | Exceptional 18.4% |
| Australians | 99.9 /100 | #58 | Exceptional 18.4% |
| Immigrants | Bulgaria | 99.9 /100 | #59 | Exceptional 18.3% |
| New Zealanders | 99.9 /100 | #60 | Exceptional 18.3% |
| Immigrants | Europe | 99.9 /100 | #61 | Exceptional 18.2% |
| Argentineans | 99.9 /100 | #62 | Exceptional 18.2% |
| Immigrants | Netherlands | 99.9 /100 | #63 | Exceptional 18.1% |
| South Africans | 99.9 /100 | #64 | Exceptional 18.1% |
| Immigrants | Kazakhstan | 99.8 /100 | #65 | Exceptional 18.0% |
| Ethiopians | 99.8 /100 | #66 | Exceptional 18.0% |
| Immigrants | Argentina | 99.8 /100 | #67 | Exceptional 18.0% |
| Immigrants | Ethiopia | 99.8 /100 | #68 | Exceptional 17.9% |
| Immigrants | Uzbekistan | 99.8 /100 | #69 | Exceptional 17.9% |
| Immigrants | Western Europe | 99.8 /100 | #70 | Exceptional 17.8% |
| Immigrants | Pakistan | 99.7 /100 | #71 | Exceptional 17.8% |