Scotch-Irish vs South African Master's Degree
COMPARE
Scotch-Irish
South African
Master's Degree
Master's Degree Comparison
Scotch-Irish
South Africans
14.4%
MASTER'S DEGREE
25.0/ 100
METRIC RATING
201st/ 347
METRIC RANK
18.1%
MASTER'S DEGREE
99.9/ 100
METRIC RATING
64th/ 347
METRIC RANK
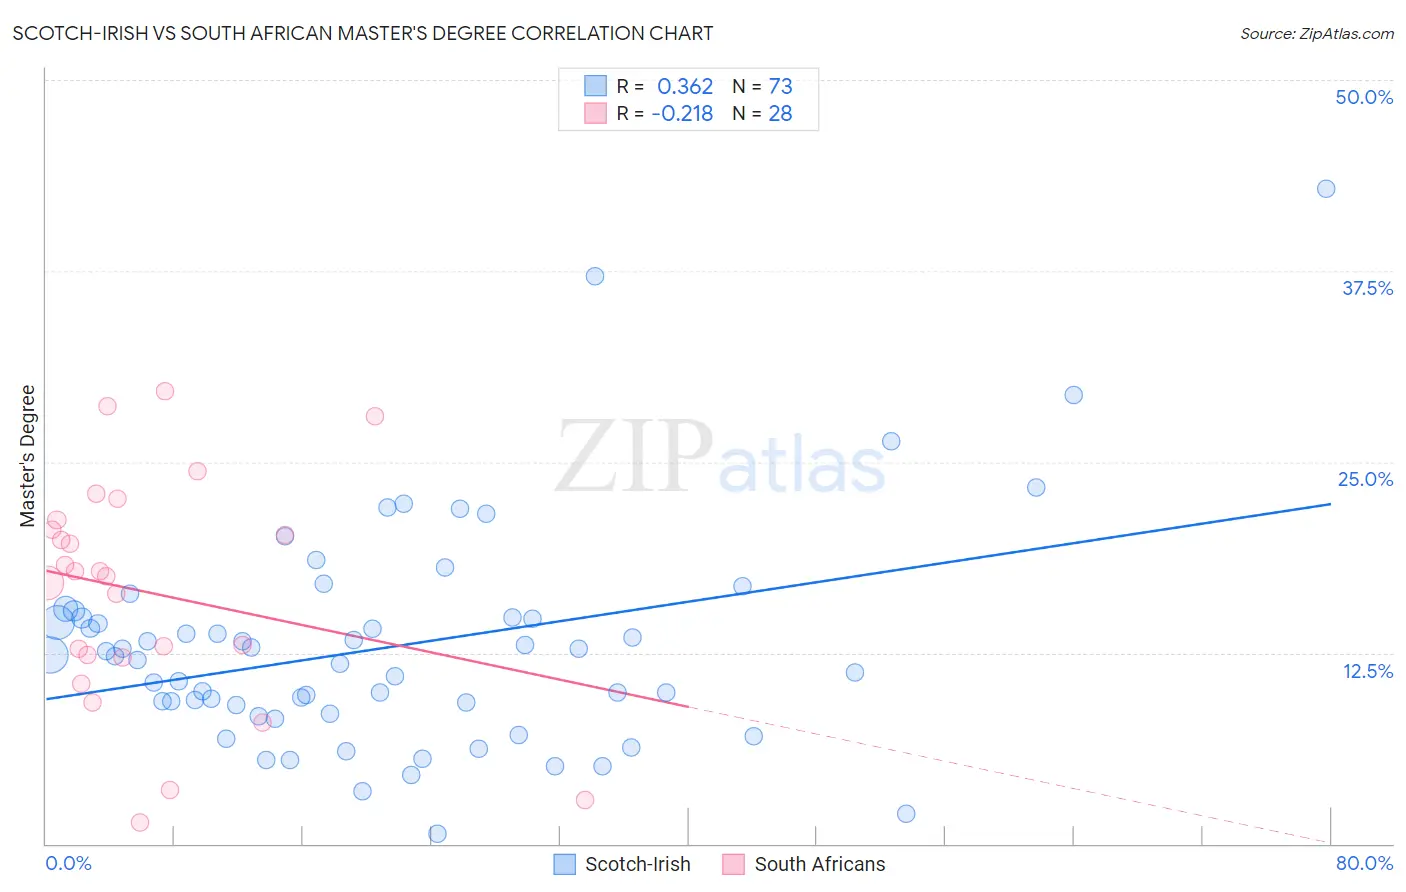
Scotch-Irish vs South African Master's Degree Correlation Chart
The statistical analysis conducted on geographies consisting of 548,205,332 people shows a mild positive correlation between the proportion of Scotch-Irish and percentage of population with at least master's degree education in the United States with a correlation coefficient (R) of 0.362 and weighted average of 14.4%. Similarly, the statistical analysis conducted on geographies consisting of 182,576,527 people shows a weak negative correlation between the proportion of South Africans and percentage of population with at least master's degree education in the United States with a correlation coefficient (R) of -0.218 and weighted average of 18.1%, a difference of 25.7%.
Master's Degree Correlation Summary
| Measurement | Scotch-Irish | South African |
| Minimum | 0.67% | 1.4% |
| Maximum | 42.9% | 29.6% |
| Range | 42.2% | 28.2% |
| Mean | 12.9% | 16.5% |
| Median | 12.3% | 17.7% |
| Interquartile 25% (IQ1) | 8.8% | 12.3% |
| Interquartile 75% (IQ3) | 14.8% | 20.9% |
| Interquartile Range (IQR) | 6.0% | 8.6% |
| Standard Deviation (Sample) | 7.2% | 7.4% |
| Standard Deviation (Population) | 7.1% | 7.3% |
Similar Demographics by Master's Degree
Demographics Similar to Scotch-Irish by Master's Degree
In terms of master's degree, the demographic groups most similar to Scotch-Irish are Panamanian (14.4%, a difference of 0.010%), Immigrants from Western Africa (14.4%, a difference of 0.010%), Yugoslavian (14.4%, a difference of 0.13%), French (14.4%, a difference of 0.24%), and Trinidadian and Tobagonian (14.4%, a difference of 0.27%).
| Demographics | Rating | Rank | Master's Degree |
| Chinese | 32.5 /100 | #194 | Fair 14.6% |
| Danes | 31.3 /100 | #195 | Fair 14.5% |
| Czechoslovakians | 29.9 /100 | #196 | Fair 14.5% |
| Belgians | 28.0 /100 | #197 | Fair 14.5% |
| West Indians | 27.4 /100 | #198 | Fair 14.5% |
| Immigrants | Armenia | 27.2 /100 | #199 | Fair 14.5% |
| Panamanians | 25.1 /100 | #200 | Fair 14.4% |
| Scotch-Irish | 25.0 /100 | #201 | Fair 14.4% |
| Immigrants | Western Africa | 24.9 /100 | #202 | Fair 14.4% |
| Yugoslavians | 24.3 /100 | #203 | Fair 14.4% |
| French | 23.7 /100 | #204 | Fair 14.4% |
| Trinidadians and Tobagonians | 23.5 /100 | #205 | Fair 14.4% |
| Scandinavians | 23.3 /100 | #206 | Fair 14.4% |
| Immigrants | Bosnia and Herzegovina | 22.0 /100 | #207 | Fair 14.3% |
| Immigrants | Barbados | 20.5 /100 | #208 | Fair 14.3% |
Demographics Similar to South Africans by Master's Degree
In terms of master's degree, the demographic groups most similar to South Africans are Immigrants from Netherlands (18.1%, a difference of 0.080%), Argentinean (18.2%, a difference of 0.44%), Immigrants from Kazakhstan (18.0%, a difference of 0.70%), Ethiopian (18.0%, a difference of 0.73%), and Immigrants from Argentina (18.0%, a difference of 0.78%).
| Demographics | Rating | Rank | Master's Degree |
| Immigrants | Asia | 99.9 /100 | #57 | Exceptional 18.4% |
| Australians | 99.9 /100 | #58 | Exceptional 18.4% |
| Immigrants | Bulgaria | 99.9 /100 | #59 | Exceptional 18.3% |
| New Zealanders | 99.9 /100 | #60 | Exceptional 18.3% |
| Immigrants | Europe | 99.9 /100 | #61 | Exceptional 18.2% |
| Argentineans | 99.9 /100 | #62 | Exceptional 18.2% |
| Immigrants | Netherlands | 99.9 /100 | #63 | Exceptional 18.1% |
| South Africans | 99.9 /100 | #64 | Exceptional 18.1% |
| Immigrants | Kazakhstan | 99.8 /100 | #65 | Exceptional 18.0% |
| Ethiopians | 99.8 /100 | #66 | Exceptional 18.0% |
| Immigrants | Argentina | 99.8 /100 | #67 | Exceptional 18.0% |
| Immigrants | Ethiopia | 99.8 /100 | #68 | Exceptional 17.9% |
| Immigrants | Uzbekistan | 99.8 /100 | #69 | Exceptional 17.9% |
| Immigrants | Western Europe | 99.8 /100 | #70 | Exceptional 17.8% |
| Immigrants | Pakistan | 99.7 /100 | #71 | Exceptional 17.8% |