Immigrants from Belarus vs South African Master's Degree
COMPARE
Immigrants from Belarus
South African
Master's Degree
Master's Degree Comparison
Immigrants from Belarus
South Africans
18.9%
MASTER'S DEGREE
100.0/ 100
METRIC RATING
45th/ 347
METRIC RANK
18.1%
MASTER'S DEGREE
99.9/ 100
METRIC RATING
64th/ 347
METRIC RANK
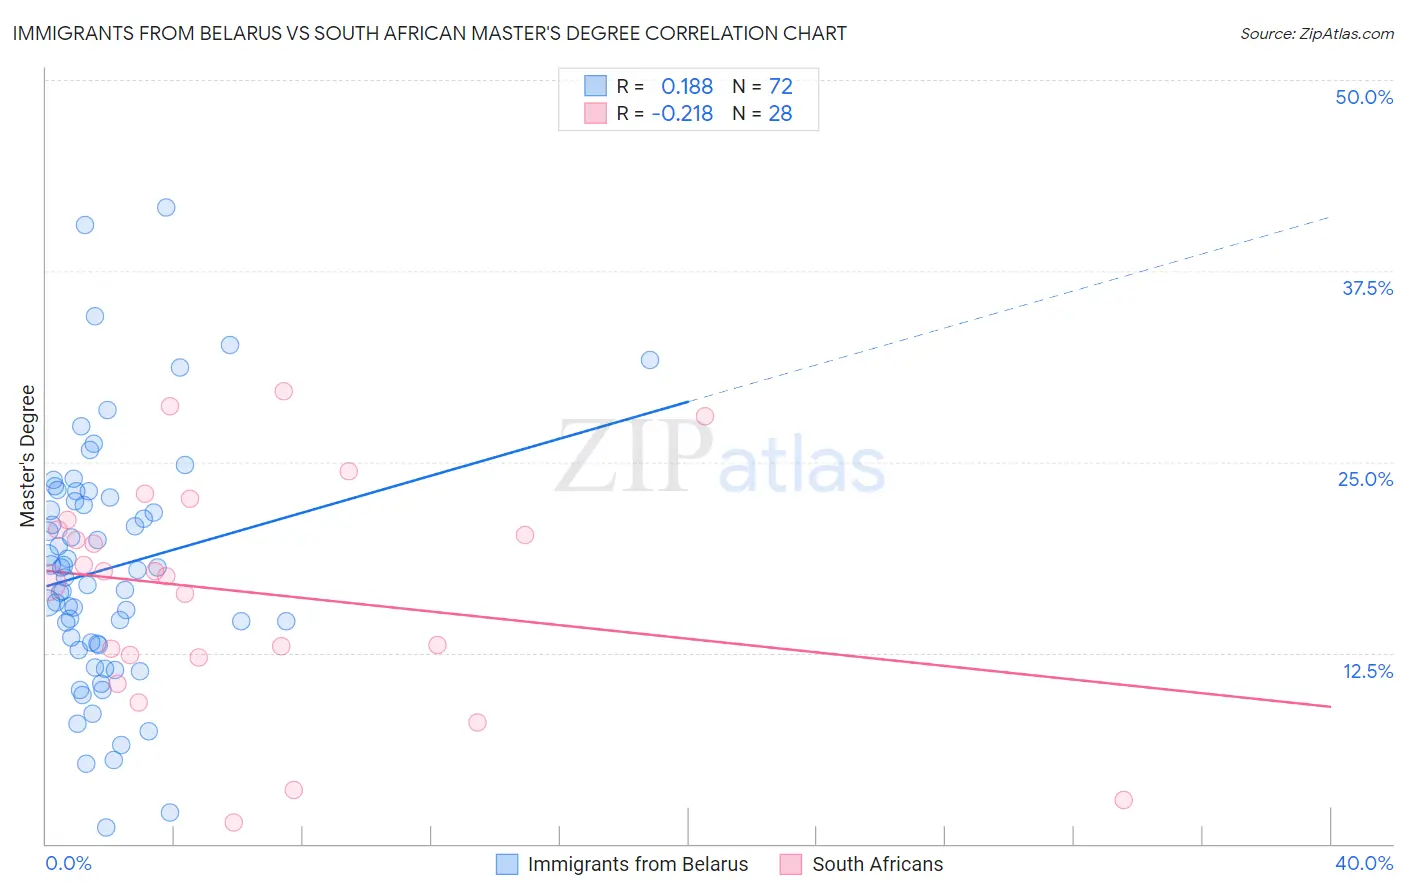
Immigrants from Belarus vs South African Master's Degree Correlation Chart
The statistical analysis conducted on geographies consisting of 150,177,035 people shows a poor positive correlation between the proportion of Immigrants from Belarus and percentage of population with at least master's degree education in the United States with a correlation coefficient (R) of 0.188 and weighted average of 18.9%. Similarly, the statistical analysis conducted on geographies consisting of 182,576,527 people shows a weak negative correlation between the proportion of South Africans and percentage of population with at least master's degree education in the United States with a correlation coefficient (R) of -0.218 and weighted average of 18.1%, a difference of 4.4%.
Master's Degree Correlation Summary
| Measurement | Immigrants from Belarus | South African |
| Minimum | 1.1% | 1.4% |
| Maximum | 41.7% | 29.6% |
| Range | 40.6% | 28.2% |
| Mean | 18.0% | 16.5% |
| Median | 17.7% | 17.7% |
| Interquartile 25% (IQ1) | 13.0% | 12.3% |
| Interquartile 75% (IQ3) | 22.5% | 20.9% |
| Interquartile Range (IQR) | 9.5% | 8.6% |
| Standard Deviation (Sample) | 8.0% | 7.4% |
| Standard Deviation (Population) | 7.9% | 7.3% |
Demographics Similar to Immigrants from Belarus and South Africans by Master's Degree
In terms of master's degree, the demographic groups most similar to Immigrants from Belarus are Immigrants from Malaysia (18.9%, a difference of 0.11%), Immigrants from Norway (18.8%, a difference of 0.38%), Immigrants from Austria (18.8%, a difference of 0.40%), Paraguayan (18.8%, a difference of 0.45%), and Estonian (18.8%, a difference of 0.55%). Similarly, the demographic groups most similar to South Africans are Immigrants from Netherlands (18.1%, a difference of 0.080%), Argentinean (18.2%, a difference of 0.44%), Immigrants from Europe (18.2%, a difference of 0.80%), New Zealander (18.3%, a difference of 0.95%), and Immigrants from Bulgaria (18.3%, a difference of 1.2%).
| Demographics | Rating | Rank | Master's Degree |
| Immigrants | Malaysia | 100.0 /100 | #44 | Exceptional 18.9% |
| Immigrants | Belarus | 100.0 /100 | #45 | Exceptional 18.9% |
| Immigrants | Norway | 100.0 /100 | #46 | Exceptional 18.8% |
| Immigrants | Austria | 100.0 /100 | #47 | Exceptional 18.8% |
| Paraguayans | 100.0 /100 | #48 | Exceptional 18.8% |
| Estonians | 100.0 /100 | #49 | Exceptional 18.8% |
| Bulgarians | 100.0 /100 | #50 | Exceptional 18.8% |
| Immigrants | South Africa | 100.0 /100 | #51 | Exceptional 18.8% |
| Immigrants | Kuwait | 100.0 /100 | #52 | Exceptional 18.6% |
| Immigrants | Czechoslovakia | 99.9 /100 | #53 | Exceptional 18.5% |
| Immigrants | Lithuania | 99.9 /100 | #54 | Exceptional 18.5% |
| Immigrants | Serbia | 99.9 /100 | #55 | Exceptional 18.5% |
| Asians | 99.9 /100 | #56 | Exceptional 18.4% |
| Immigrants | Asia | 99.9 /100 | #57 | Exceptional 18.4% |
| Australians | 99.9 /100 | #58 | Exceptional 18.4% |
| Immigrants | Bulgaria | 99.9 /100 | #59 | Exceptional 18.3% |
| New Zealanders | 99.9 /100 | #60 | Exceptional 18.3% |
| Immigrants | Europe | 99.9 /100 | #61 | Exceptional 18.2% |
| Argentineans | 99.9 /100 | #62 | Exceptional 18.2% |
| Immigrants | Netherlands | 99.9 /100 | #63 | Exceptional 18.1% |
| South Africans | 99.9 /100 | #64 | Exceptional 18.1% |