Chickasaw vs Immigrants from Latin America Master's Degree

COMPARE

Chickasaw
Race
Ancestry
AfghanAfricanAlaska NativeAlaskan AthabascanAlbanianAleutAlsatianAmericanApacheArabArapahoArgentineanArmenianAssyrian/Chaldean/SyriacAustralianAustrianBahamianBangladeshiBarbadianBasqueBelgianBelizeanBermudanBhutaneseBlackfeetBolivianBrazilianBritishBritish West IndianBulgarianBurmeseCajunCambodianCanadianCape VerdeanCarpatho RusynCelticCentral AmericanCentral American IndianCherokeeCheyenneChickasawChileanChineseChippewaChoctawColombianColvilleComancheCosta RicanCreeCreekCroatianCrowCubanCypriotCzechCzechoslovakianDanishDelawareDominicanDutchDutch West IndianEastern EuropeanEcuadorianEgyptianEnglishEstonianEthiopianEuropeanFijianFilipinoFinnishFrenchFrench American IndianFrench CanadianGermanGerman RussianGhanaianGreekGuamanian/ChamorroGuatemalanGuyaneseHaitianHmongHonduranHopiHoumaHungarianIcelanderIndian (Asian)IndonesianInupiatIranianIraqiIrishIroquoisIsraeliItalianJamaicanJapaneseJordanianKenyanKiowaKoreanLaotianLatvianLebaneseLiberianLithuanianLumbeeLuxembourgerMacedonianMalaysianMalteseMarshalleseMenomineeMexicanMexican American IndianMongolianMoroccanNative HawaiianNavajoNepaleseNew ZealanderNicaraguanNigerianNorthern EuropeanNorwegianOkinawanOsageOttawaPaiutePakistaniPalestinianPanamanianParaguayanPennsylvania GermanPeruvianPimaPolishPortuguesePotawatomiPuebloPuerto RicanPuget Sound SalishRomanianRussianSalvadoranSamoanScandinavianScotch-IrishScottishSeminoleSenegaleseSerbianShoshoneSierra LeoneanSiouxSlavicSlovakSloveneSomaliSouth AfricanSouth AmericanSouth American IndianSoviet UnionSpaniardSpanishSpanish AmericanSpanish American IndianSri LankanSubsaharan AfricanSudaneseSwedishSwissSyrianTaiwaneseThaiTlingit-HaidaTohono O'OdhamTonganTrinidadian and TobagonianTsimshianTurkishU.S. Virgin IslanderUgandanUkrainianUruguayanUteVenezuelanVietnameseWelshWest IndianYakamaYaquiYugoslavianYumanYup'ikZimbabwean
Immigration
NonimmigrantsImmigrantsAfghanistanAfricaAlbaniaArgentinaArmeniaAsiaAustraliaAustriaBahamasBangladeshBarbadosBelarusBelgiumBelizeBoliviaBosnia and HerzegovinaBrazilBulgariaBurma/MyanmarCabo VerdeCambodiaCameroonCanadaCaribbeanCentral AmericaChileChinaColombiaCongoCosta RicaCroatiaCubaCzechoslovakiaDenmarkDominicaDominican RepublicEastern AfricaEastern AsiaEastern EuropeEcuadorEgyptEl SalvadorEnglandEritreaEthiopiaEuropeFijiFranceGermanyGhanaGreeceGrenadaGuatemalaGuyanaHaitiHondurasHong KongHungaryIndiaIndonesiaIranIraqIrelandIsraelItalyJamaicaJapanJordanKazakhstanKenyaKoreaKuwaitLaosLatviaLebanonLiberiaLithuaniaMalaysiaMexicoMicronesiaMiddle AfricaMoldovaMoroccoNepalNetherlandsNicaraguaNigeriaNorth AmericaNorth MacedoniaNorthern AfricaNorthern EuropeNorwayOceaniaPakistanPanamaPeruPhilippinesPolandPortugalRomaniaRussiaSaudi ArabiaScotlandSenegalSerbiaSierra LeoneSingaporeSomaliaSouth AfricaSouth AmericaSouth Central AsiaSouth Eastern AsiaSouthern EuropeSpainSri LankaSt. Vincent and the GrenadinesSudanSwedenSwitzerlandSyriaTaiwanThailandTrinidad and TobagoTurkeyUgandaUkraineUruguayUzbekistanVenezuelaVietnamWest IndiesWestern AfricaWestern AsiaWestern EuropeYemenZaireZimbabweAzores
Immigrants from Latin America
Race
Ancestry
AfghanAfricanAlaska NativeAlaskan AthabascanAlbanianAleutAlsatianAmericanApacheArabArapahoArgentineanArmenianAssyrian/Chaldean/SyriacAustralianAustrianBahamianBangladeshiBarbadianBasqueBelgianBelizeanBermudanBhutaneseBlackfeetBolivianBrazilianBritishBritish West IndianBulgarianBurmeseCajunCambodianCanadianCape VerdeanCarpatho RusynCelticCentral AmericanCentral American IndianCherokeeCheyenneChileanChineseChippewaChoctawColombianColvilleComancheCosta RicanCreeCreekCroatianCrowCubanCypriotCzechCzechoslovakianDanishDelawareDominicanDutchDutch West IndianEastern EuropeanEcuadorianEgyptianEnglishEstonianEthiopianEuropeanFijianFilipinoFinnishFrenchFrench American IndianFrench CanadianGermanGerman RussianGhanaianGreekGuamanian/ChamorroGuatemalanGuyaneseHaitianHmongHonduranHopiHoumaHungarianIcelanderIndian (Asian)IndonesianInupiatIranianIraqiIrishIroquoisIsraeliItalianJamaicanJapaneseJordanianKenyanKiowaKoreanLaotianLatvianLebaneseLiberianLithuanianLumbeeLuxembourgerMacedonianMalaysianMalteseMarshalleseMenomineeMexicanMexican American IndianMongolianMoroccanNative HawaiianNavajoNepaleseNew ZealanderNicaraguanNigerianNorthern EuropeanNorwegianOkinawanOsageOttawaPaiutePakistaniPalestinianPanamanianParaguayanPennsylvania GermanPeruvianPimaPolishPortuguesePotawatomiPuebloPuerto RicanPuget Sound SalishRomanianRussianSalvadoranSamoanScandinavianScotch-IrishScottishSeminoleSenegaleseSerbianShoshoneSierra LeoneanSiouxSlavicSlovakSloveneSomaliSouth AfricanSouth AmericanSouth American IndianSoviet UnionSpaniardSpanishSpanish AmericanSpanish American IndianSri LankanSubsaharan AfricanSudaneseSwedishSwissSyrianTaiwaneseThaiTlingit-HaidaTohono O'OdhamTonganTrinidadian and TobagonianTsimshianTurkishU.S. Virgin IslanderUgandanUkrainianUruguayanUteVenezuelanVietnameseWelshWest IndianYakamaYaquiYugoslavianYumanYup'ikZimbabwean
Immigration
NonimmigrantsImmigrantsAfghanistanAfricaAlbaniaArgentinaArmeniaAsiaAustraliaAustriaBahamasBangladeshBarbadosBelarusBelgiumBelizeBoliviaBosnia and HerzegovinaBrazilBulgariaBurma/MyanmarCabo VerdeCambodiaCameroonCanadaCaribbeanCentral AmericaChileChinaColombiaCongoCosta RicaCroatiaCubaCzechoslovakiaDenmarkDominicaDominican RepublicEastern AfricaEastern AsiaEastern EuropeEcuadorEgyptEl SalvadorEnglandEritreaEthiopiaEuropeFijiFranceGermanyGhanaGreeceGrenadaGuatemalaGuyanaHaitiHondurasHong KongHungaryIndiaIndonesiaIranIraqIrelandIsraelItalyJamaicaJapanJordanKazakhstanKenyaKoreaKuwaitLaosLatin AmericaLatviaLebanonLiberiaLithuaniaMalaysiaMexicoMicronesiaMiddle AfricaMoldovaMoroccoNepalNetherlandsNicaraguaNigeriaNorth AmericaNorth MacedoniaNorthern AfricaNorthern EuropeNorwayOceaniaPakistanPanamaPeruPhilippinesPolandPortugalRomaniaRussiaSaudi ArabiaScotlandSenegalSerbiaSierra LeoneSingaporeSomaliaSouth AfricaSouth AmericaSouth Central AsiaSouth Eastern AsiaSouthern EuropeSpainSri LankaSt. Vincent and the GrenadinesSudanSwedenSwitzerlandSyriaTaiwanThailandTrinidad and TobagoTurkeyUgandaUkraineUruguayUzbekistanVenezuelaVietnamWest IndiesWestern AfricaWestern AsiaWestern EuropeYemenZaireZimbabweAzores
Master's Degree
Income
Poverty
Unemployment
Labor Participation
Family Structure
Vehicle Availability
Education Level
Disability

Master's Degree Comparison

Chickasaw

Immigrants from Latin America

Tragic
Tragic
11.4%
MASTER'S DEGREE
0.1/ 100
METRIC RATING
299th/ 347
METRIC RANK
11.3%
MASTER'S DEGREE
0.0/ 100
METRIC RATING
305th/ 347
METRIC RANK

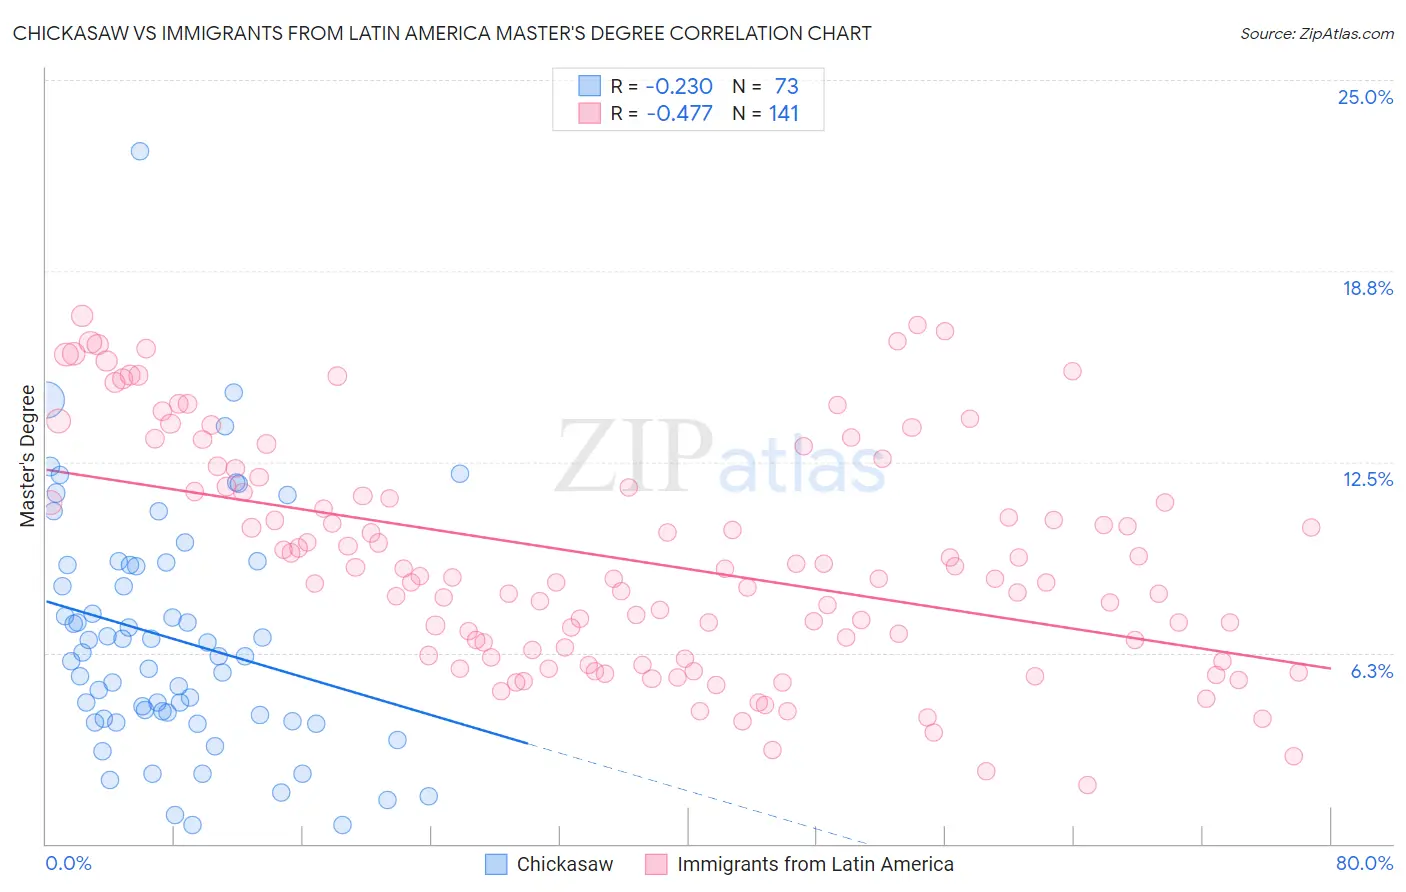
Chickasaw vs Immigrants from Latin America Master's Degree Correlation Chart

The statistical analysis conducted on geographies consisting of 147,685,526 people shows a weak negative correlation between the proportion of Chickasaw and percentage of population with at least master's degree education in the United States with a correlation coefficient (R) of -0.230 and weighted average of 11.4%. Similarly, the statistical analysis conducted on geographies consisting of 557,625,876 people shows a moderate negative correlation between the proportion of Immigrants from Latin America and percentage of population with at least master's degree education in the United States with a correlation coefficient (R) of -0.477 and weighted average of 11.3%, a difference of 1.3%.
Chickasaw vs Immigrants from Latin America Master's Degree

Master's Degree Correlation Summary

MeasurementChickasawImmigrants from Latin America
Minimum0.60%1.9%
Maximum22.7%17.3%
Range22.1%15.4%
Mean6.7%9.3%
Median6.1%8.7%
Interquartile 25% (IQ1)4.1%6.3%
Interquartile 75% (IQ3)9.1%11.7%
Interquartile Range (IQR)5.1%5.4%
Standard Deviation (Sample)3.9%3.7%
Standard Deviation (Population)3.9%3.7%

Demographics Similar to Chickasaw and Immigrants from Latin America by Master's Degree

In terms of master's degree, the demographic groups most similar to Chickasaw are Chippewa (11.4%, a difference of 0.020%), Tsimshian (11.4%, a difference of 0.18%), Samoan (11.5%, a difference of 0.46%), Cherokee (11.4%, a difference of 0.49%), and Immigrants from Laos (11.4%, a difference of 0.51%). Similarly, the demographic groups most similar to Immigrants from Latin America are Mexican American Indian (11.2%, a difference of 0.19%), Cheyenne (11.2%, a difference of 0.34%), Immigrants from Cabo Verde (11.3%, a difference of 0.65%), Immigrants from Laos (11.4%, a difference of 0.84%), and Cherokee (11.4%, a difference of 0.86%).
DemographicsRating | RankMaster's Degree
Immigrants | Guatemala
0.1
/100
|
#292
Tragic
11.6%
Alaska Natives
0.1
/100
|
#293
Tragic
11.6%
Hawaiians
0.1
/100
|
#294
Tragic
11.6%
Marshallese
0.1
/100
|
#295
Tragic
11.6%
Alaskan Athabascans
0.1
/100
|
#296
Tragic
11.6%
Immigrants | Yemen
0.1
/100
|
#297
Tragic
11.6%
Samoans
0.1
/100
|
#298
Tragic
11.5%
Chickasaw
0.1
/100
|
#299
Tragic
11.4%
Chippewa
0.1
/100
|
#300
Tragic
11.4%
Tsimshian
0.1
/100
|
#301
Tragic
11.4%
Cherokee
0.1
/100
|
#302
Tragic
11.4%
Immigrants | Laos
0.1
/100
|
#303
Tragic
11.4%
Immigrants | Cabo Verde
0.1
/100
|
#304
Tragic
11.3%
Immigrants | Latin America
0.0
/100
|
#305
Tragic
11.3%
Mexican American Indians
0.0
/100
|
#306
Tragic
11.2%
Cheyenne
0.0
/100
|
#307
Tragic
11.2%
Puerto Ricans
0.0
/100
|
#308
Tragic
11.2%
Puget Sound Salish
0.0
/100
|
#309
Tragic
11.1%
Shoshone
0.0
/100
|
#310
Tragic
11.1%
Seminole
0.0
/100
|
#311
Tragic
11.0%
Choctaw
0.0
/100
|
#312
Tragic
11.0%