Immigrants from Bahamas vs South African Master's Degree
COMPARE
Immigrants from Bahamas
South African
Master's Degree
Master's Degree Comparison
Immigrants from Bahamas
South Africans
12.9%
MASTER'S DEGREE
1.4/ 100
METRIC RATING
245th/ 347
METRIC RANK
18.1%
MASTER'S DEGREE
99.9/ 100
METRIC RATING
64th/ 347
METRIC RANK
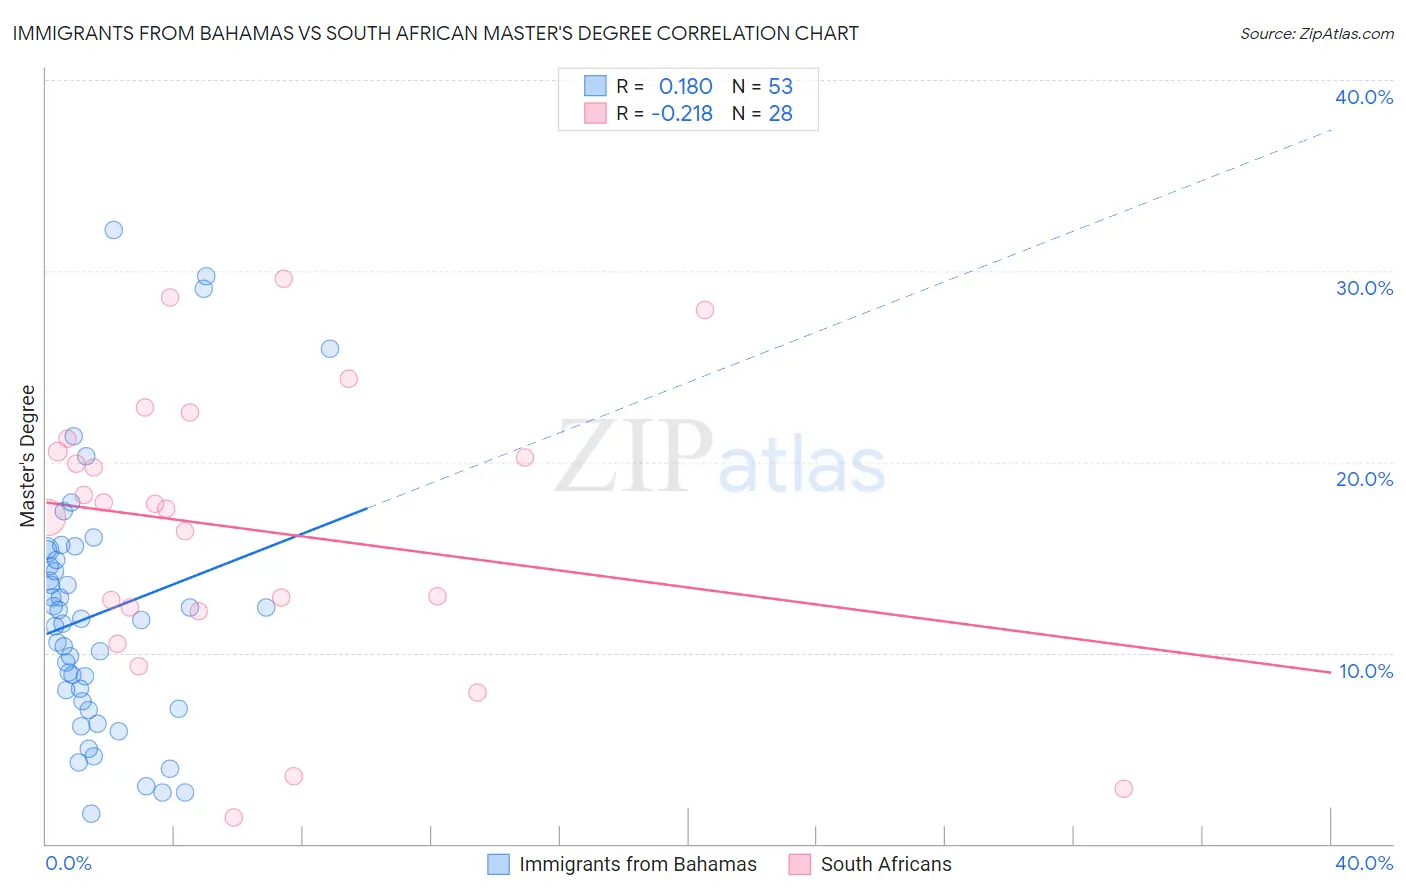
Immigrants from Bahamas vs South African Master's Degree Correlation Chart
The statistical analysis conducted on geographies consisting of 104,646,319 people shows a poor positive correlation between the proportion of Immigrants from Bahamas and percentage of population with at least master's degree education in the United States with a correlation coefficient (R) of 0.180 and weighted average of 12.9%. Similarly, the statistical analysis conducted on geographies consisting of 182,576,527 people shows a weak negative correlation between the proportion of South Africans and percentage of population with at least master's degree education in the United States with a correlation coefficient (R) of -0.218 and weighted average of 18.1%, a difference of 40.3%.
Master's Degree Correlation Summary
| Measurement | Immigrants from Bahamas | South African |
| Minimum | 1.6% | 1.4% |
| Maximum | 32.1% | 29.6% |
| Range | 30.6% | 28.2% |
| Mean | 12.0% | 16.5% |
| Median | 11.7% | 17.7% |
| Interquartile 25% (IQ1) | 7.3% | 12.3% |
| Interquartile 75% (IQ3) | 15.1% | 20.9% |
| Interquartile Range (IQR) | 7.9% | 8.6% |
| Standard Deviation (Sample) | 6.7% | 7.4% |
| Standard Deviation (Population) | 6.7% | 7.3% |
Similar Demographics by Master's Degree
Demographics Similar to Immigrants from Bahamas by Master's Degree
In terms of master's degree, the demographic groups most similar to Immigrants from Bahamas are Immigrants from Cambodia (12.9%, a difference of 0.040%), Iroquois (12.9%, a difference of 0.070%), African (12.9%, a difference of 0.16%), Cree (12.8%, a difference of 0.47%), and Liberian (12.8%, a difference of 0.47%).
| Demographics | Rating | Rank | Master's Degree |
| Hmong | 4.0 /100 | #238 | Tragic 13.4% |
| Immigrants | Nonimmigrants | 3.4 /100 | #239 | Tragic 13.3% |
| Guamanians/Chamorros | 2.2 /100 | #240 | Tragic 13.1% |
| U.S. Virgin Islanders | 2.1 /100 | #241 | Tragic 13.1% |
| Spanish Americans | 1.9 /100 | #242 | Tragic 13.0% |
| Immigrants | Jamaica | 1.9 /100 | #243 | Tragic 13.0% |
| Delaware | 1.7 /100 | #244 | Tragic 13.0% |
| Immigrants | Bahamas | 1.4 /100 | #245 | Tragic 12.9% |
| Immigrants | Cambodia | 1.4 /100 | #246 | Tragic 12.9% |
| Iroquois | 1.4 /100 | #247 | Tragic 12.9% |
| Africans | 1.4 /100 | #248 | Tragic 12.9% |
| Cree | 1.3 /100 | #249 | Tragic 12.8% |
| Liberians | 1.3 /100 | #250 | Tragic 12.8% |
| Tlingit-Haida | 1.3 /100 | #251 | Tragic 12.8% |
| French American Indians | 1.0 /100 | #252 | Tragic 12.7% |
Demographics Similar to South Africans by Master's Degree
In terms of master's degree, the demographic groups most similar to South Africans are Immigrants from Netherlands (18.1%, a difference of 0.080%), Argentinean (18.2%, a difference of 0.44%), Immigrants from Kazakhstan (18.0%, a difference of 0.70%), Ethiopian (18.0%, a difference of 0.73%), and Immigrants from Argentina (18.0%, a difference of 0.78%).
| Demographics | Rating | Rank | Master's Degree |
| Immigrants | Asia | 99.9 /100 | #57 | Exceptional 18.4% |
| Australians | 99.9 /100 | #58 | Exceptional 18.4% |
| Immigrants | Bulgaria | 99.9 /100 | #59 | Exceptional 18.3% |
| New Zealanders | 99.9 /100 | #60 | Exceptional 18.3% |
| Immigrants | Europe | 99.9 /100 | #61 | Exceptional 18.2% |
| Argentineans | 99.9 /100 | #62 | Exceptional 18.2% |
| Immigrants | Netherlands | 99.9 /100 | #63 | Exceptional 18.1% |
| South Africans | 99.9 /100 | #64 | Exceptional 18.1% |
| Immigrants | Kazakhstan | 99.8 /100 | #65 | Exceptional 18.0% |
| Ethiopians | 99.8 /100 | #66 | Exceptional 18.0% |
| Immigrants | Argentina | 99.8 /100 | #67 | Exceptional 18.0% |
| Immigrants | Ethiopia | 99.8 /100 | #68 | Exceptional 17.9% |
| Immigrants | Uzbekistan | 99.8 /100 | #69 | Exceptional 17.9% |
| Immigrants | Western Europe | 99.8 /100 | #70 | Exceptional 17.8% |
| Immigrants | Pakistan | 99.7 /100 | #71 | Exceptional 17.8% |