Chickasaw vs Shoshone Associate's Degree
COMPARE
Chickasaw
Shoshone
Associate's Degree
Associate's Degree Comparison
Chickasaw
Shoshone
38.6%
ASSOCIATE'S DEGREE
0.0/ 100
METRIC RATING
300th/ 347
METRIC RANK
38.4%
ASSOCIATE'S DEGREE
0.0/ 100
METRIC RATING
306th/ 347
METRIC RANK
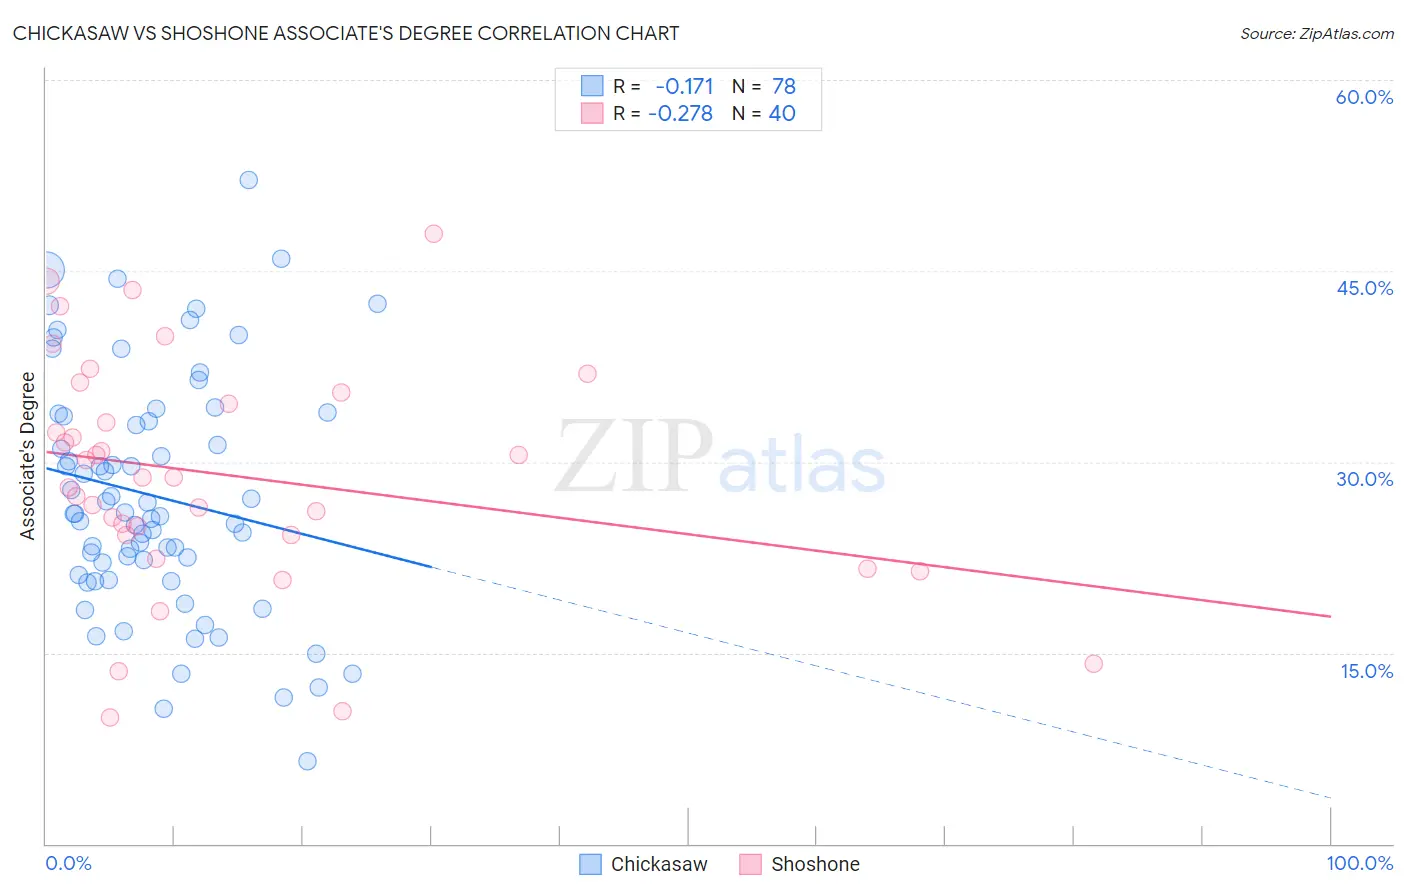
Chickasaw vs Shoshone Associate's Degree Correlation Chart
The statistical analysis conducted on geographies consisting of 147,722,780 people shows a poor negative correlation between the proportion of Chickasaw and percentage of population with at least associate's degree education in the United States with a correlation coefficient (R) of -0.171 and weighted average of 38.6%. Similarly, the statistical analysis conducted on geographies consisting of 66,627,351 people shows a weak negative correlation between the proportion of Shoshone and percentage of population with at least associate's degree education in the United States with a correlation coefficient (R) of -0.278 and weighted average of 38.4%, a difference of 0.48%.
Associate's Degree Correlation Summary
| Measurement | Chickasaw | Shoshone |
| Minimum | 6.5% | 9.9% |
| Maximum | 52.2% | 47.9% |
| Range | 45.7% | 38.0% |
| Mean | 27.3% | 28.9% |
| Median | 25.9% | 28.7% |
| Interquartile 25% (IQ1) | 21.1% | 24.2% |
| Interquartile 75% (IQ3) | 33.6% | 35.0% |
| Interquartile Range (IQR) | 12.5% | 10.7% |
| Standard Deviation (Sample) | 9.4% | 9.0% |
| Standard Deviation (Population) | 9.3% | 8.8% |
Demographics Similar to Chickasaw and Shoshone by Associate's Degree
In terms of associate's degree, the demographic groups most similar to Chickasaw are Ute (38.6%, a difference of 0.040%), Tsimshian (38.6%, a difference of 0.060%), Cheyenne (38.7%, a difference of 0.13%), Colville (38.5%, a difference of 0.20%), and Guatemalan (38.5%, a difference of 0.29%). Similarly, the demographic groups most similar to Shoshone are Immigrants from El Salvador (38.4%, a difference of 0.040%), Immigrants from Honduras (38.5%, a difference of 0.070%), Sioux (38.5%, a difference of 0.13%), Guatemalan (38.5%, a difference of 0.19%), and Colville (38.5%, a difference of 0.27%).
| Demographics | Rating | Rank | Associate's Degree |
| Nepalese | 0.0 /100 | #293 | Tragic 39.0% |
| Salvadorans | 0.0 /100 | #294 | Tragic 39.0% |
| Hondurans | 0.0 /100 | #295 | Tragic 38.9% |
| Cherokee | 0.0 /100 | #296 | Tragic 38.9% |
| Cape Verdeans | 0.0 /100 | #297 | Tragic 38.8% |
| Cheyenne | 0.0 /100 | #298 | Tragic 38.7% |
| Ute | 0.0 /100 | #299 | Tragic 38.6% |
| Chickasaw | 0.0 /100 | #300 | Tragic 38.6% |
| Tsimshian | 0.0 /100 | #301 | Tragic 38.6% |
| Colville | 0.0 /100 | #302 | Tragic 38.5% |
| Guatemalans | 0.0 /100 | #303 | Tragic 38.5% |
| Sioux | 0.0 /100 | #304 | Tragic 38.5% |
| Immigrants | Honduras | 0.0 /100 | #305 | Tragic 38.5% |
| Shoshone | 0.0 /100 | #306 | Tragic 38.4% |
| Immigrants | El Salvador | 0.0 /100 | #307 | Tragic 38.4% |
| Mexican American Indians | 0.0 /100 | #308 | Tragic 38.2% |
| Immigrants | Guatemala | 0.0 /100 | #309 | Tragic 38.1% |
| Immigrants | Dominican Republic | 0.0 /100 | #310 | Tragic 37.9% |
| Immigrants | Latin America | 0.0 /100 | #311 | Tragic 37.9% |
| Choctaw | 0.0 /100 | #312 | Tragic 37.8% |
| Hispanics or Latinos | 0.0 /100 | #313 | Tragic 37.7% |