Senegalese vs Shoshone Associate's Degree
COMPARE
Senegalese
Shoshone
Associate's Degree
Associate's Degree Comparison
Senegalese
Shoshone
45.2%
ASSOCIATE'S DEGREE
21.1/ 100
METRIC RATING
200th/ 347
METRIC RANK
38.4%
ASSOCIATE'S DEGREE
0.0/ 100
METRIC RATING
306th/ 347
METRIC RANK
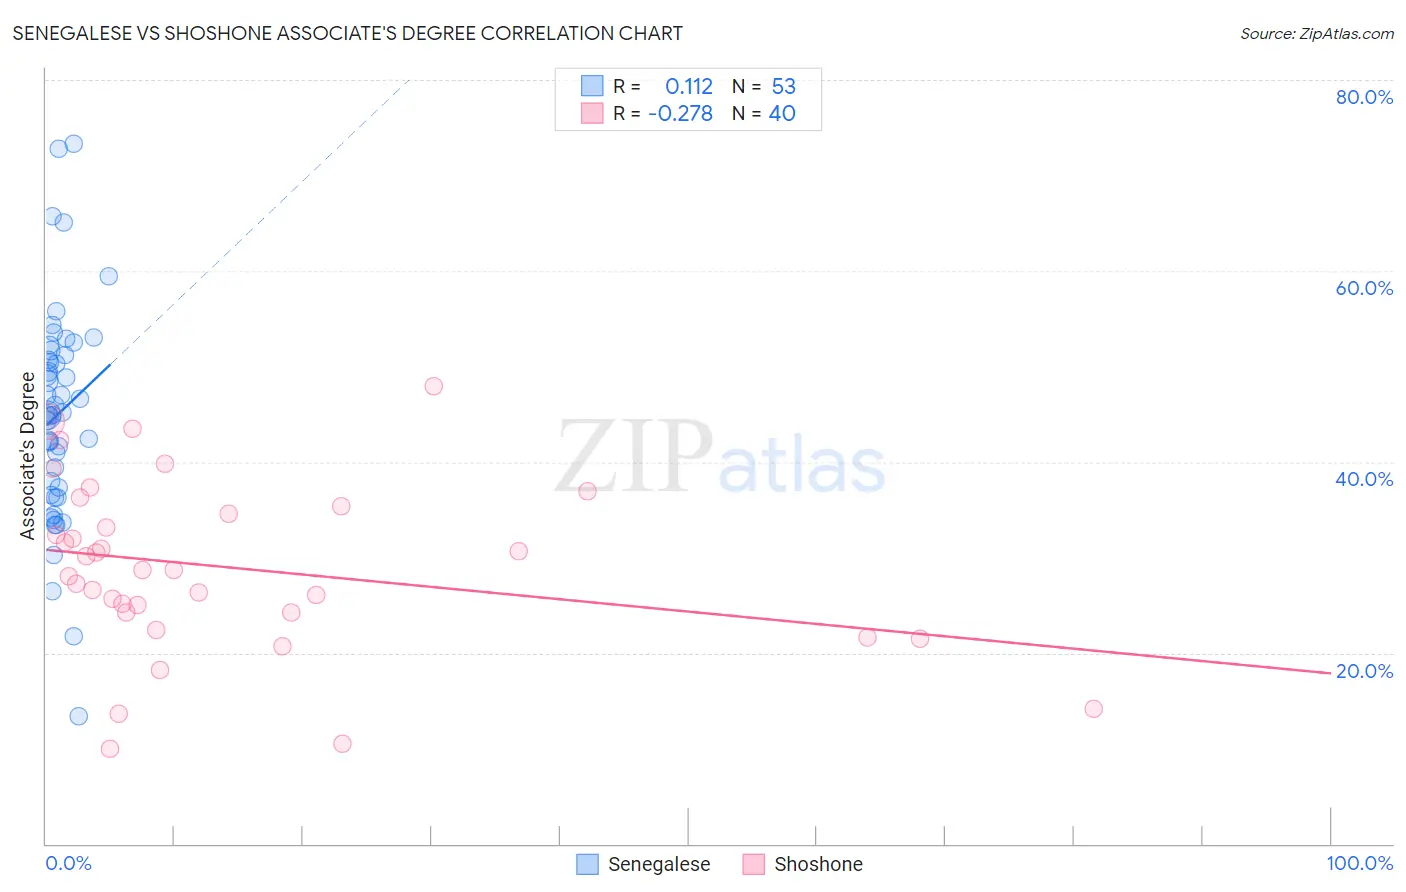
Senegalese vs Shoshone Associate's Degree Correlation Chart
The statistical analysis conducted on geographies consisting of 78,136,633 people shows a poor positive correlation between the proportion of Senegalese and percentage of population with at least associate's degree education in the United States with a correlation coefficient (R) of 0.112 and weighted average of 45.2%. Similarly, the statistical analysis conducted on geographies consisting of 66,627,351 people shows a weak negative correlation between the proportion of Shoshone and percentage of population with at least associate's degree education in the United States with a correlation coefficient (R) of -0.278 and weighted average of 38.4%, a difference of 17.7%.
Associate's Degree Correlation Summary
| Measurement | Senegalese | Shoshone |
| Minimum | 13.4% | 9.9% |
| Maximum | 73.4% | 47.9% |
| Range | 60.0% | 38.0% |
| Mean | 45.0% | 28.9% |
| Median | 44.9% | 28.7% |
| Interquartile 25% (IQ1) | 36.9% | 24.2% |
| Interquartile 75% (IQ3) | 51.4% | 35.0% |
| Interquartile Range (IQR) | 14.5% | 10.7% |
| Standard Deviation (Sample) | 11.3% | 9.0% |
| Standard Deviation (Population) | 11.2% | 8.8% |
Similar Demographics by Associate's Degree
Demographics Similar to Senegalese by Associate's Degree
In terms of associate's degree, the demographic groups most similar to Senegalese are Immigrants from Senegal (45.2%, a difference of 0.010%), Immigrants from Bangladesh (45.2%, a difference of 0.030%), Immigrants from Vietnam (45.2%, a difference of 0.030%), Spaniard (45.2%, a difference of 0.080%), and Immigrants from South Eastern Asia (45.2%, a difference of 0.10%).
| Demographics | Rating | Rank | Associate's Degree |
| Immigrants | Cameroon | 31.0 /100 | #193 | Fair 45.7% |
| Immigrants | Peru | 27.6 /100 | #194 | Fair 45.5% |
| Germans | 26.5 /100 | #195 | Fair 45.5% |
| French | 25.6 /100 | #196 | Fair 45.4% |
| Scotch-Irish | 22.3 /100 | #197 | Fair 45.3% |
| Immigrants | Bangladesh | 21.3 /100 | #198 | Fair 45.2% |
| Immigrants | Senegal | 21.2 /100 | #199 | Fair 45.2% |
| Senegalese | 21.1 /100 | #200 | Fair 45.2% |
| Immigrants | Vietnam | 20.8 /100 | #201 | Fair 45.2% |
| Spaniards | 20.4 /100 | #202 | Fair 45.2% |
| Immigrants | South Eastern Asia | 20.2 /100 | #203 | Fair 45.2% |
| Nigerians | 19.1 /100 | #204 | Poor 45.1% |
| Immigrants | Thailand | 18.9 /100 | #205 | Poor 45.1% |
| German Russians | 18.9 /100 | #206 | Poor 45.1% |
| Panamanians | 18.4 /100 | #207 | Poor 45.1% |
Demographics Similar to Shoshone by Associate's Degree
In terms of associate's degree, the demographic groups most similar to Shoshone are Immigrants from El Salvador (38.4%, a difference of 0.040%), Immigrants from Honduras (38.5%, a difference of 0.070%), Sioux (38.5%, a difference of 0.13%), Guatemalan (38.5%, a difference of 0.19%), and Colville (38.5%, a difference of 0.27%).
| Demographics | Rating | Rank | Associate's Degree |
| Ute | 0.0 /100 | #299 | Tragic 38.6% |
| Chickasaw | 0.0 /100 | #300 | Tragic 38.6% |
| Tsimshian | 0.0 /100 | #301 | Tragic 38.6% |
| Colville | 0.0 /100 | #302 | Tragic 38.5% |
| Guatemalans | 0.0 /100 | #303 | Tragic 38.5% |
| Sioux | 0.0 /100 | #304 | Tragic 38.5% |
| Immigrants | Honduras | 0.0 /100 | #305 | Tragic 38.5% |
| Shoshone | 0.0 /100 | #306 | Tragic 38.4% |
| Immigrants | El Salvador | 0.0 /100 | #307 | Tragic 38.4% |
| Mexican American Indians | 0.0 /100 | #308 | Tragic 38.2% |
| Immigrants | Guatemala | 0.0 /100 | #309 | Tragic 38.1% |
| Immigrants | Dominican Republic | 0.0 /100 | #310 | Tragic 37.9% |
| Immigrants | Latin America | 0.0 /100 | #311 | Tragic 37.9% |
| Choctaw | 0.0 /100 | #312 | Tragic 37.8% |
| Hispanics or Latinos | 0.0 /100 | #313 | Tragic 37.7% |