Immigrants from Barbados vs Shoshone Associate's Degree
COMPARE
Immigrants from Barbados
Shoshone
Associate's Degree
Associate's Degree Comparison
Immigrants from Barbados
Shoshone
43.3%
ASSOCIATE'S DEGREE
2.9/ 100
METRIC RATING
230th/ 347
METRIC RANK
38.4%
ASSOCIATE'S DEGREE
0.0/ 100
METRIC RATING
306th/ 347
METRIC RANK
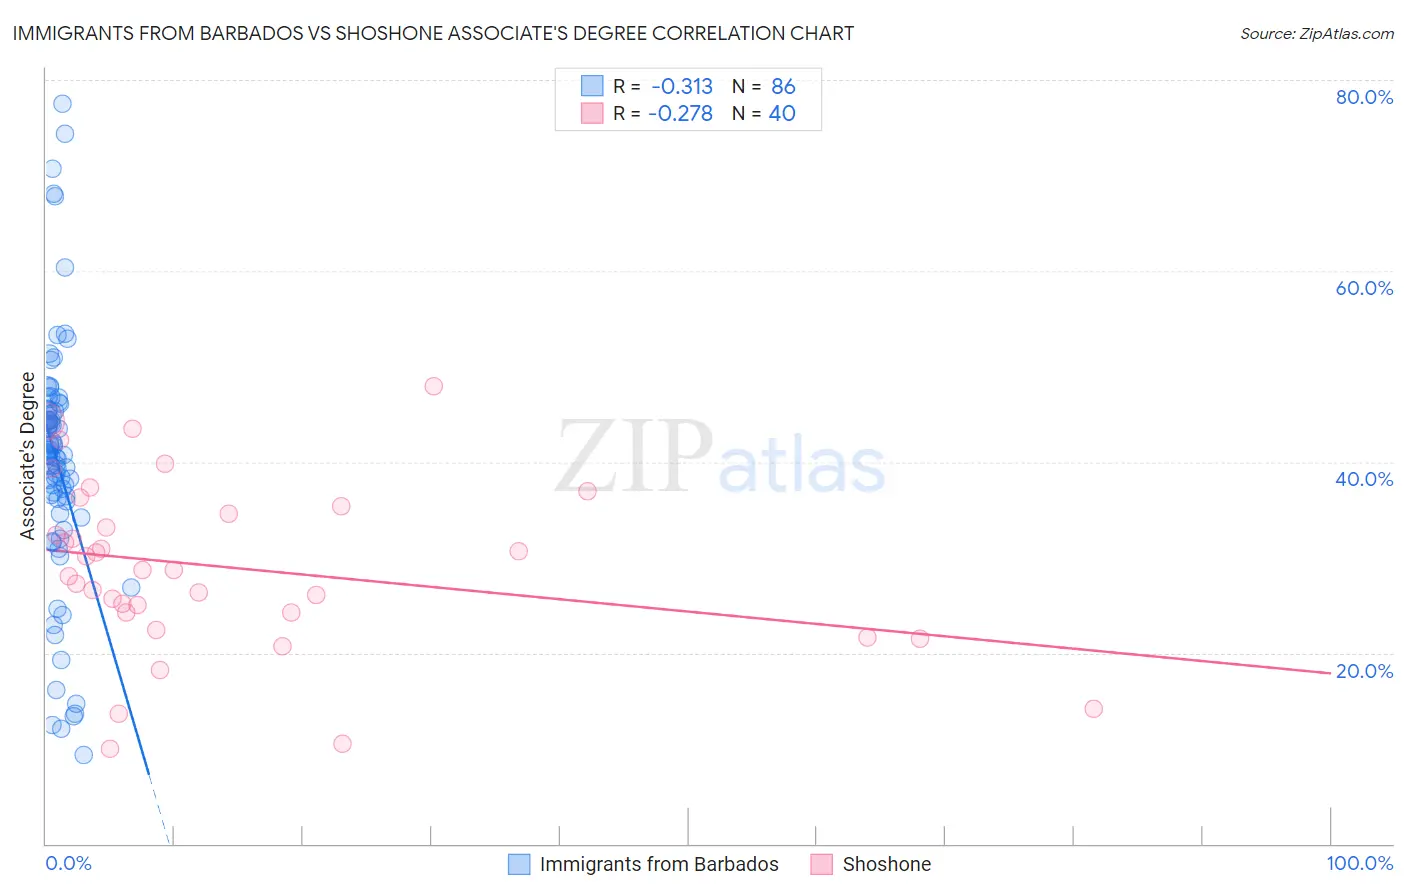
Immigrants from Barbados vs Shoshone Associate's Degree Correlation Chart
The statistical analysis conducted on geographies consisting of 112,783,541 people shows a mild negative correlation between the proportion of Immigrants from Barbados and percentage of population with at least associate's degree education in the United States with a correlation coefficient (R) of -0.313 and weighted average of 43.3%. Similarly, the statistical analysis conducted on geographies consisting of 66,627,351 people shows a weak negative correlation between the proportion of Shoshone and percentage of population with at least associate's degree education in the United States with a correlation coefficient (R) of -0.278 and weighted average of 38.4%, a difference of 12.7%.
Associate's Degree Correlation Summary
| Measurement | Immigrants from Barbados | Shoshone |
| Minimum | 9.3% | 9.9% |
| Maximum | 77.4% | 47.9% |
| Range | 68.2% | 38.0% |
| Mean | 40.0% | 28.9% |
| Median | 40.7% | 28.7% |
| Interquartile 25% (IQ1) | 35.9% | 24.2% |
| Interquartile 75% (IQ3) | 45.3% | 35.0% |
| Interquartile Range (IQR) | 9.5% | 10.7% |
| Standard Deviation (Sample) | 13.1% | 9.0% |
| Standard Deviation (Population) | 13.0% | 8.8% |
Similar Demographics by Associate's Degree
Demographics Similar to Immigrants from Barbados by Associate's Degree
In terms of associate's degree, the demographic groups most similar to Immigrants from Barbados are Liberian (43.3%, a difference of 0.010%), Immigrants from Trinidad and Tobago (43.3%, a difference of 0.070%), Hmong (43.4%, a difference of 0.23%), Native Hawaiian (43.1%, a difference of 0.43%), and Tongan (43.0%, a difference of 0.60%).
| Demographics | Rating | Rank | Associate's Degree |
| Sub-Saharan Africans | 5.5 /100 | #223 | Tragic 43.9% |
| West Indians | 5.2 /100 | #224 | Tragic 43.8% |
| Guamanians/Chamorros | 4.8 /100 | #225 | Tragic 43.8% |
| Immigrants | Burma/Myanmar | 4.3 /100 | #226 | Tragic 43.7% |
| Trinidadians and Tobagonians | 4.0 /100 | #227 | Tragic 43.6% |
| Hmong | 3.2 /100 | #228 | Tragic 43.4% |
| Immigrants | Trinidad and Tobago | 3.0 /100 | #229 | Tragic 43.3% |
| Immigrants | Barbados | 2.9 /100 | #230 | Tragic 43.3% |
| Liberians | 2.9 /100 | #231 | Tragic 43.3% |
| Native Hawaiians | 2.3 /100 | #232 | Tragic 43.1% |
| Tongans | 2.2 /100 | #233 | Tragic 43.0% |
| Tlingit-Haida | 2.1 /100 | #234 | Tragic 43.0% |
| Ecuadorians | 2.0 /100 | #235 | Tragic 43.0% |
| Immigrants | St. Vincent and the Grenadines | 1.9 /100 | #236 | Tragic 42.9% |
| Immigrants | Nonimmigrants | 1.9 /100 | #237 | Tragic 42.9% |
Demographics Similar to Shoshone by Associate's Degree
In terms of associate's degree, the demographic groups most similar to Shoshone are Immigrants from El Salvador (38.4%, a difference of 0.040%), Immigrants from Honduras (38.5%, a difference of 0.070%), Sioux (38.5%, a difference of 0.13%), Guatemalan (38.5%, a difference of 0.19%), and Colville (38.5%, a difference of 0.27%).
| Demographics | Rating | Rank | Associate's Degree |
| Ute | 0.0 /100 | #299 | Tragic 38.6% |
| Chickasaw | 0.0 /100 | #300 | Tragic 38.6% |
| Tsimshian | 0.0 /100 | #301 | Tragic 38.6% |
| Colville | 0.0 /100 | #302 | Tragic 38.5% |
| Guatemalans | 0.0 /100 | #303 | Tragic 38.5% |
| Sioux | 0.0 /100 | #304 | Tragic 38.5% |
| Immigrants | Honduras | 0.0 /100 | #305 | Tragic 38.5% |
| Shoshone | 0.0 /100 | #306 | Tragic 38.4% |
| Immigrants | El Salvador | 0.0 /100 | #307 | Tragic 38.4% |
| Mexican American Indians | 0.0 /100 | #308 | Tragic 38.2% |
| Immigrants | Guatemala | 0.0 /100 | #309 | Tragic 38.1% |
| Immigrants | Dominican Republic | 0.0 /100 | #310 | Tragic 37.9% |
| Immigrants | Latin America | 0.0 /100 | #311 | Tragic 37.9% |
| Choctaw | 0.0 /100 | #312 | Tragic 37.8% |
| Hispanics or Latinos | 0.0 /100 | #313 | Tragic 37.7% |