Native Hawaiian vs Shoshone Associate's Degree
COMPARE
Native Hawaiian
Shoshone
Associate's Degree
Associate's Degree Comparison
Native Hawaiians
Shoshone
43.1%
ASSOCIATE'S DEGREE
2.3/ 100
METRIC RATING
232nd/ 347
METRIC RANK
38.4%
ASSOCIATE'S DEGREE
0.0/ 100
METRIC RATING
306th/ 347
METRIC RANK
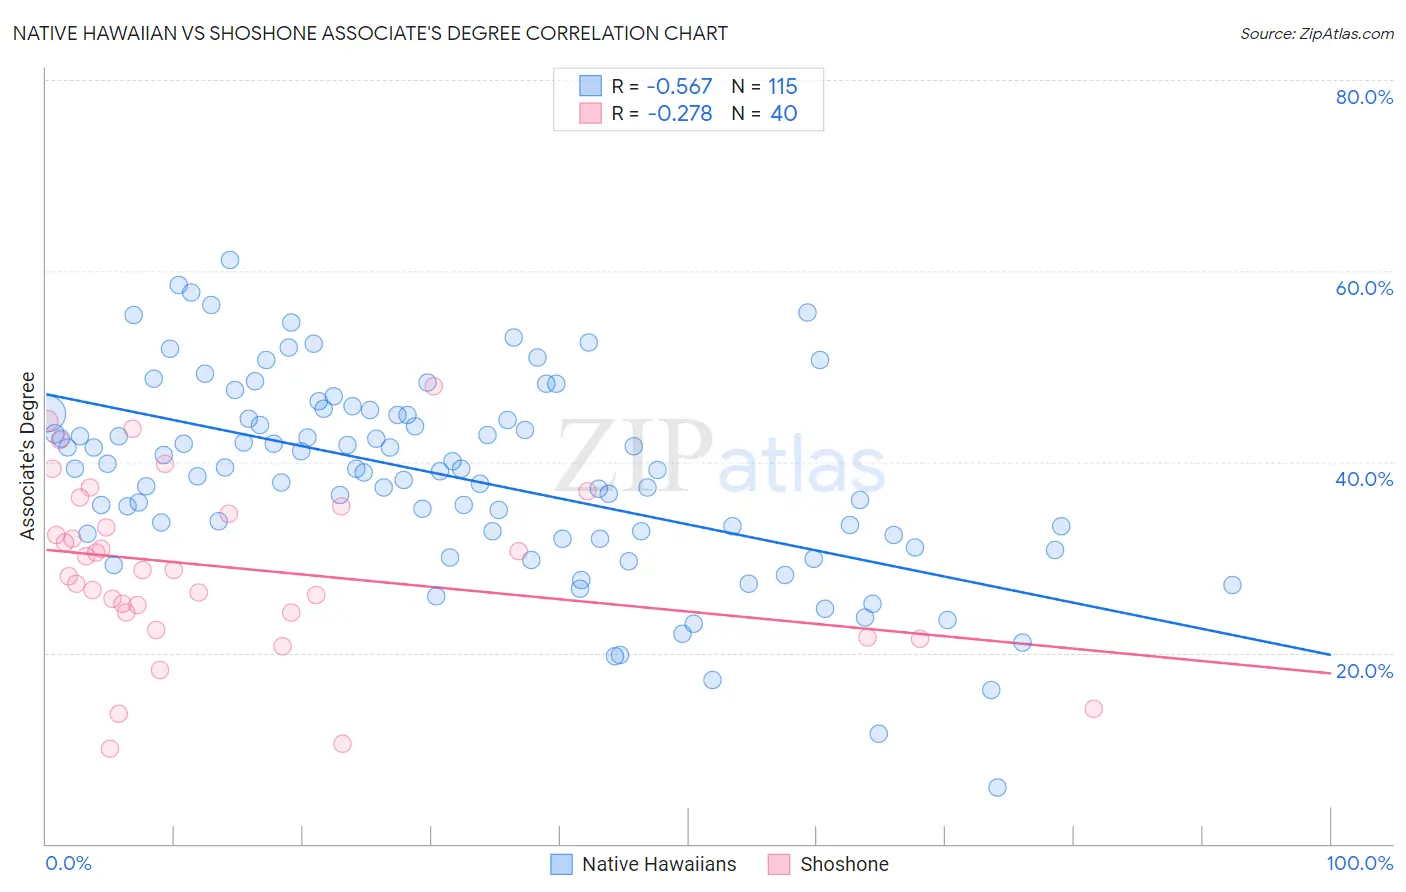
Native Hawaiian vs Shoshone Associate's Degree Correlation Chart
The statistical analysis conducted on geographies consisting of 332,098,475 people shows a substantial negative correlation between the proportion of Native Hawaiians and percentage of population with at least associate's degree education in the United States with a correlation coefficient (R) of -0.567 and weighted average of 43.1%. Similarly, the statistical analysis conducted on geographies consisting of 66,627,351 people shows a weak negative correlation between the proportion of Shoshone and percentage of population with at least associate's degree education in the United States with a correlation coefficient (R) of -0.278 and weighted average of 38.4%, a difference of 12.2%.
Associate's Degree Correlation Summary
| Measurement | Native Hawaiian | Shoshone |
| Minimum | 5.9% | 9.9% |
| Maximum | 61.2% | 47.9% |
| Range | 55.3% | 38.0% |
| Mean | 38.4% | 28.9% |
| Median | 39.3% | 28.7% |
| Interquartile 25% (IQ1) | 32.3% | 24.2% |
| Interquartile 75% (IQ3) | 44.9% | 35.0% |
| Interquartile Range (IQR) | 12.6% | 10.7% |
| Standard Deviation (Sample) | 10.3% | 9.0% |
| Standard Deviation (Population) | 10.3% | 8.8% |
Similar Demographics by Associate's Degree
Demographics Similar to Native Hawaiians by Associate's Degree
In terms of associate's degree, the demographic groups most similar to Native Hawaiians are Tongan (43.0%, a difference of 0.16%), Tlingit-Haida (43.0%, a difference of 0.25%), Ecuadorian (43.0%, a difference of 0.35%), Immigrants from Barbados (43.3%, a difference of 0.43%), and Liberian (43.3%, a difference of 0.43%).
| Demographics | Rating | Rank | Associate's Degree |
| Guamanians/Chamorros | 4.8 /100 | #225 | Tragic 43.8% |
| Immigrants | Burma/Myanmar | 4.3 /100 | #226 | Tragic 43.7% |
| Trinidadians and Tobagonians | 4.0 /100 | #227 | Tragic 43.6% |
| Hmong | 3.2 /100 | #228 | Tragic 43.4% |
| Immigrants | Trinidad and Tobago | 3.0 /100 | #229 | Tragic 43.3% |
| Immigrants | Barbados | 2.9 /100 | #230 | Tragic 43.3% |
| Liberians | 2.9 /100 | #231 | Tragic 43.3% |
| Native Hawaiians | 2.3 /100 | #232 | Tragic 43.1% |
| Tongans | 2.2 /100 | #233 | Tragic 43.0% |
| Tlingit-Haida | 2.1 /100 | #234 | Tragic 43.0% |
| Ecuadorians | 2.0 /100 | #235 | Tragic 43.0% |
| Immigrants | St. Vincent and the Grenadines | 1.9 /100 | #236 | Tragic 42.9% |
| Immigrants | Nonimmigrants | 1.9 /100 | #237 | Tragic 42.9% |
| Iroquois | 1.7 /100 | #238 | Tragic 42.8% |
| Immigrants | Grenada | 1.3 /100 | #239 | Tragic 42.6% |
Demographics Similar to Shoshone by Associate's Degree
In terms of associate's degree, the demographic groups most similar to Shoshone are Immigrants from El Salvador (38.4%, a difference of 0.040%), Immigrants from Honduras (38.5%, a difference of 0.070%), Sioux (38.5%, a difference of 0.13%), Guatemalan (38.5%, a difference of 0.19%), and Colville (38.5%, a difference of 0.27%).
| Demographics | Rating | Rank | Associate's Degree |
| Ute | 0.0 /100 | #299 | Tragic 38.6% |
| Chickasaw | 0.0 /100 | #300 | Tragic 38.6% |
| Tsimshian | 0.0 /100 | #301 | Tragic 38.6% |
| Colville | 0.0 /100 | #302 | Tragic 38.5% |
| Guatemalans | 0.0 /100 | #303 | Tragic 38.5% |
| Sioux | 0.0 /100 | #304 | Tragic 38.5% |
| Immigrants | Honduras | 0.0 /100 | #305 | Tragic 38.5% |
| Shoshone | 0.0 /100 | #306 | Tragic 38.4% |
| Immigrants | El Salvador | 0.0 /100 | #307 | Tragic 38.4% |
| Mexican American Indians | 0.0 /100 | #308 | Tragic 38.2% |
| Immigrants | Guatemala | 0.0 /100 | #309 | Tragic 38.1% |
| Immigrants | Dominican Republic | 0.0 /100 | #310 | Tragic 37.9% |
| Immigrants | Latin America | 0.0 /100 | #311 | Tragic 37.9% |
| Choctaw | 0.0 /100 | #312 | Tragic 37.8% |
| Hispanics or Latinos | 0.0 /100 | #313 | Tragic 37.7% |