Immigrants from Bahamas vs Shoshone Associate's Degree
COMPARE
Immigrants from Bahamas
Shoshone
Associate's Degree
Associate's Degree Comparison
Immigrants from Bahamas
Shoshone
42.1%
ASSOCIATE'S DEGREE
0.7/ 100
METRIC RATING
251st/ 347
METRIC RANK
38.4%
ASSOCIATE'S DEGREE
0.0/ 100
METRIC RATING
306th/ 347
METRIC RANK
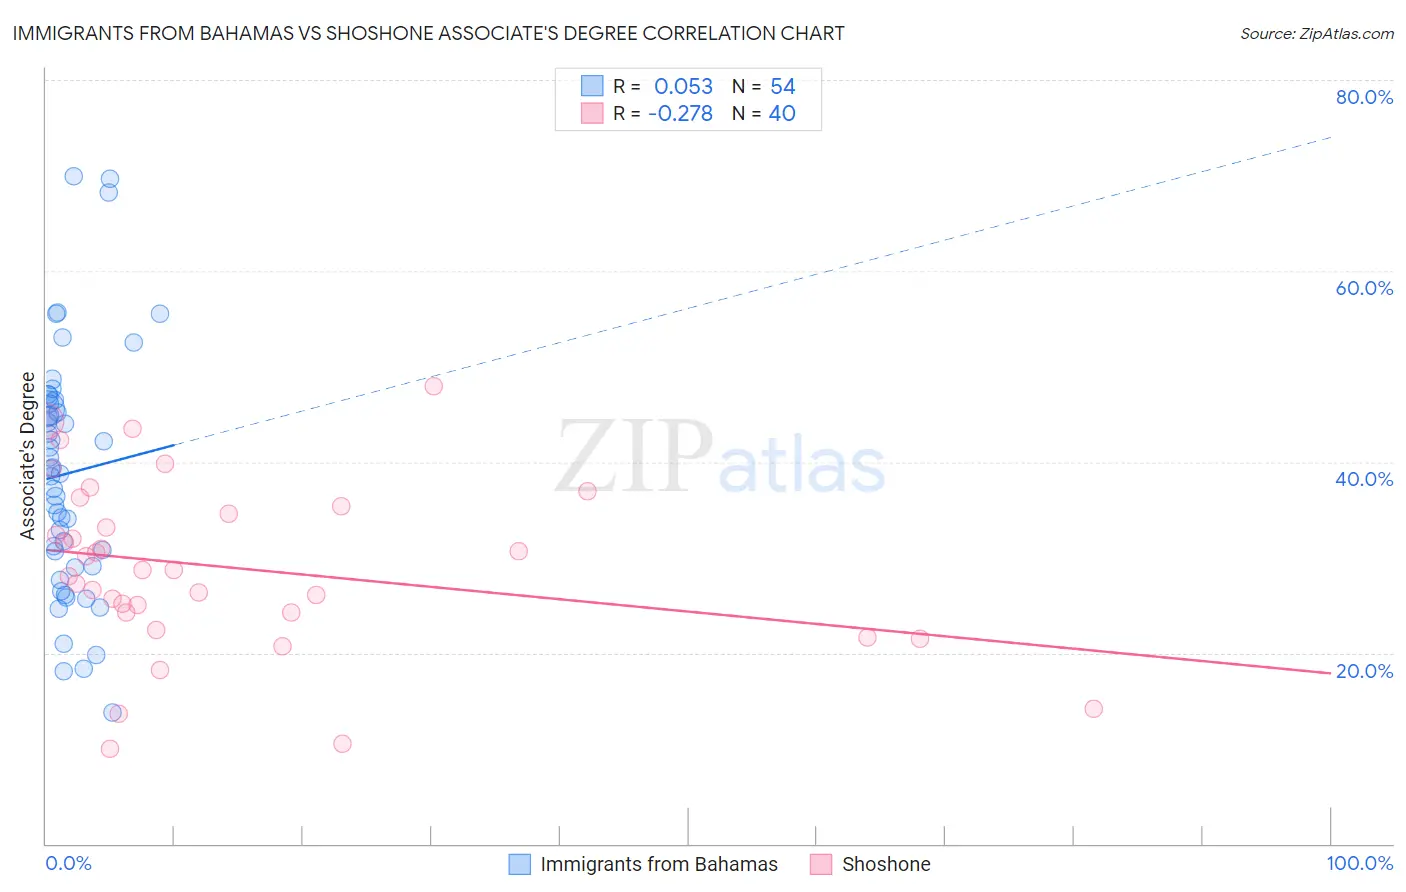
Immigrants from Bahamas vs Shoshone Associate's Degree Correlation Chart
The statistical analysis conducted on geographies consisting of 104,664,532 people shows a slight positive correlation between the proportion of Immigrants from Bahamas and percentage of population with at least associate's degree education in the United States with a correlation coefficient (R) of 0.053 and weighted average of 42.1%. Similarly, the statistical analysis conducted on geographies consisting of 66,627,351 people shows a weak negative correlation between the proportion of Shoshone and percentage of population with at least associate's degree education in the United States with a correlation coefficient (R) of -0.278 and weighted average of 38.4%, a difference of 9.6%.
Associate's Degree Correlation Summary
| Measurement | Immigrants from Bahamas | Shoshone |
| Minimum | 13.7% | 9.9% |
| Maximum | 69.9% | 47.9% |
| Range | 56.2% | 38.0% |
| Mean | 38.8% | 28.9% |
| Median | 39.0% | 28.7% |
| Interquartile 25% (IQ1) | 29.0% | 24.2% |
| Interquartile 75% (IQ3) | 46.1% | 35.0% |
| Interquartile Range (IQR) | 17.0% | 10.7% |
| Standard Deviation (Sample) | 12.7% | 9.0% |
| Standard Deviation (Population) | 12.6% | 8.8% |
Similar Demographics by Associate's Degree
Demographics Similar to Immigrants from Bahamas by Associate's Degree
In terms of associate's degree, the demographic groups most similar to Immigrants from Bahamas are U.S. Virgin Islander (42.1%, a difference of 0.020%), Jamaican (42.1%, a difference of 0.030%), Immigrants from Ecuador (42.2%, a difference of 0.18%), Immigrants from Fiji (42.2%, a difference of 0.26%), and Delaware (42.3%, a difference of 0.35%).
| Demographics | Rating | Rank | Associate's Degree |
| Immigrants | Liberia | 0.9 /100 | #244 | Tragic 42.3% |
| Immigrants | Cambodia | 0.9 /100 | #245 | Tragic 42.3% |
| Delaware | 0.9 /100 | #246 | Tragic 42.3% |
| Immigrants | Fiji | 0.8 /100 | #247 | Tragic 42.2% |
| Immigrants | Ecuador | 0.8 /100 | #248 | Tragic 42.2% |
| Jamaicans | 0.7 /100 | #249 | Tragic 42.1% |
| U.S. Virgin Islanders | 0.7 /100 | #250 | Tragic 42.1% |
| Immigrants | Bahamas | 0.7 /100 | #251 | Tragic 42.1% |
| French American Indians | 0.6 /100 | #252 | Tragic 42.0% |
| Indonesians | 0.6 /100 | #253 | Tragic 41.9% |
| Cubans | 0.6 /100 | #254 | Tragic 41.9% |
| Immigrants | Guyana | 0.5 /100 | #255 | Tragic 41.8% |
| Immigrants | Congo | 0.5 /100 | #256 | Tragic 41.8% |
| Spanish Americans | 0.5 /100 | #257 | Tragic 41.8% |
| Japanese | 0.5 /100 | #258 | Tragic 41.7% |
Demographics Similar to Shoshone by Associate's Degree
In terms of associate's degree, the demographic groups most similar to Shoshone are Immigrants from El Salvador (38.4%, a difference of 0.040%), Immigrants from Honduras (38.5%, a difference of 0.070%), Sioux (38.5%, a difference of 0.13%), Guatemalan (38.5%, a difference of 0.19%), and Colville (38.5%, a difference of 0.27%).
| Demographics | Rating | Rank | Associate's Degree |
| Ute | 0.0 /100 | #299 | Tragic 38.6% |
| Chickasaw | 0.0 /100 | #300 | Tragic 38.6% |
| Tsimshian | 0.0 /100 | #301 | Tragic 38.6% |
| Colville | 0.0 /100 | #302 | Tragic 38.5% |
| Guatemalans | 0.0 /100 | #303 | Tragic 38.5% |
| Sioux | 0.0 /100 | #304 | Tragic 38.5% |
| Immigrants | Honduras | 0.0 /100 | #305 | Tragic 38.5% |
| Shoshone | 0.0 /100 | #306 | Tragic 38.4% |
| Immigrants | El Salvador | 0.0 /100 | #307 | Tragic 38.4% |
| Mexican American Indians | 0.0 /100 | #308 | Tragic 38.2% |
| Immigrants | Guatemala | 0.0 /100 | #309 | Tragic 38.1% |
| Immigrants | Dominican Republic | 0.0 /100 | #310 | Tragic 37.9% |
| Immigrants | Latin America | 0.0 /100 | #311 | Tragic 37.9% |
| Choctaw | 0.0 /100 | #312 | Tragic 37.8% |
| Hispanics or Latinos | 0.0 /100 | #313 | Tragic 37.7% |