Chickasaw vs Chippewa College, Under 1 year
COMPARE
Chickasaw
Chippewa
College, Under 1 year
College, Under 1 year Comparison
Chickasaw
Chippewa
60.4%
COLLEGE, UNDER 1 YEAR
0.1/ 100
METRIC RATING
273rd/ 347
METRIC RANK
62.6%
COLLEGE, UNDER 1 YEAR
2.0/ 100
METRIC RATING
234th/ 347
METRIC RANK
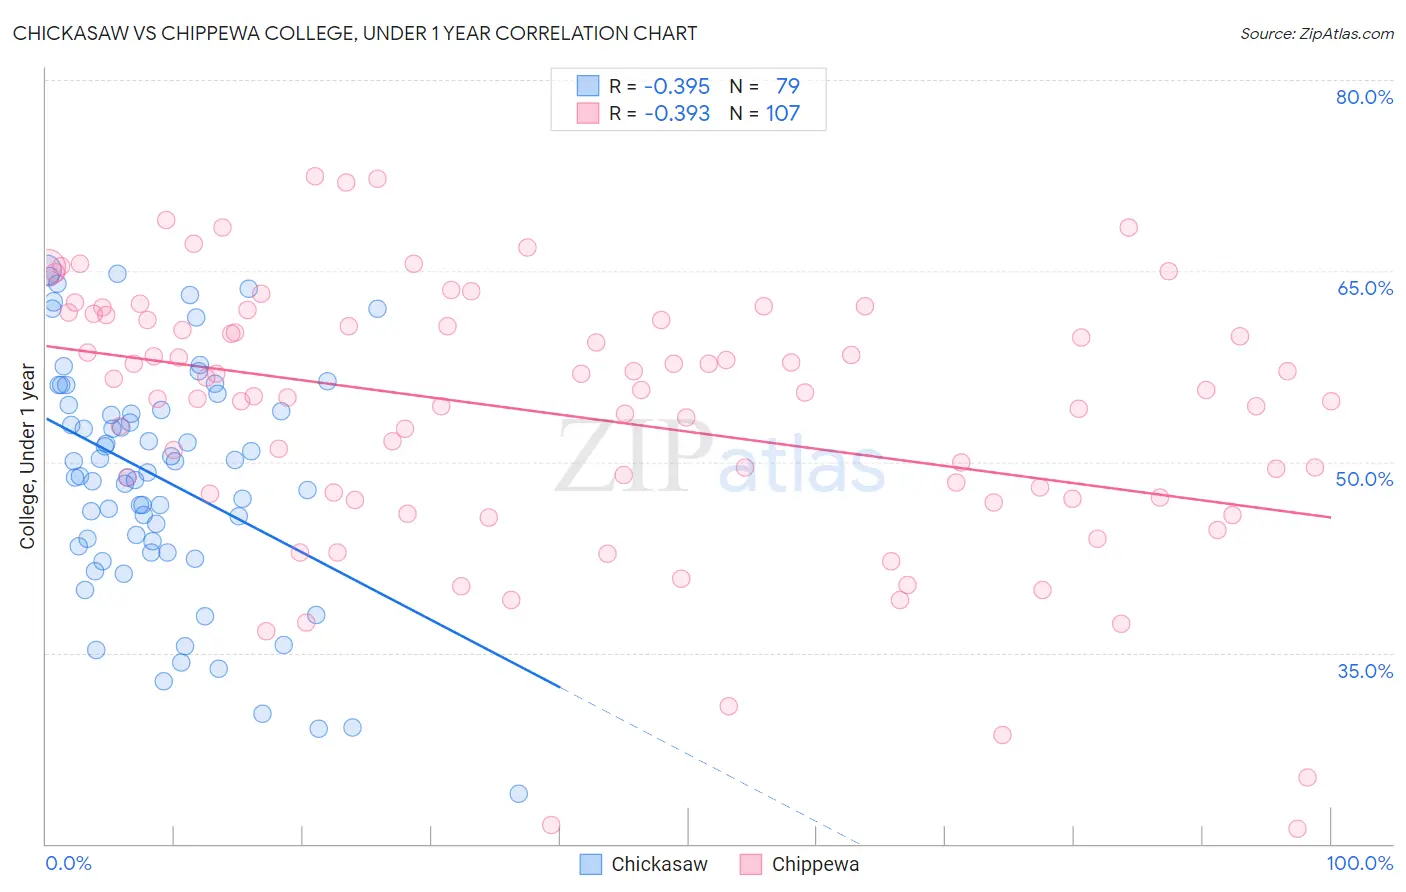
Chickasaw vs Chippewa College, Under 1 year Correlation Chart
The statistical analysis conducted on geographies consisting of 147,726,589 people shows a mild negative correlation between the proportion of Chickasaw and percentage of population with at least college, under 1 year education in the United States with a correlation coefficient (R) of -0.395 and weighted average of 60.4%. Similarly, the statistical analysis conducted on geographies consisting of 215,068,018 people shows a mild negative correlation between the proportion of Chippewa and percentage of population with at least college, under 1 year education in the United States with a correlation coefficient (R) of -0.393 and weighted average of 62.6%, a difference of 3.6%.
College, Under 1 year Correlation Summary
| Measurement | Chickasaw | Chippewa |
| Minimum | 23.9% | 21.2% |
| Maximum | 65.1% | 72.5% |
| Range | 41.2% | 51.3% |
| Mean | 48.7% | 53.6% |
| Median | 49.2% | 55.5% |
| Interquartile 25% (IQ1) | 43.4% | 47.2% |
| Interquartile 75% (IQ3) | 54.5% | 61.1% |
| Interquartile Range (IQR) | 11.1% | 14.0% |
| Standard Deviation (Sample) | 9.2% | 10.5% |
| Standard Deviation (Population) | 9.2% | 10.5% |
Similar Demographics by College, Under 1 year
Demographics Similar to Chickasaw by College, Under 1 year
In terms of college, under 1 year, the demographic groups most similar to Chickasaw are Alaska Native (60.4%, a difference of 0.0%), Jamaican (60.5%, a difference of 0.050%), Immigrants from Barbados (60.4%, a difference of 0.13%), Arapaho (60.3%, a difference of 0.16%), and U.S. Virgin Islander (60.6%, a difference of 0.20%).
| Demographics | Rating | Rank | College, Under 1 year |
| Alaskan Athabascans | 0.2 /100 | #266 | Tragic 61.0% |
| Americans | 0.2 /100 | #267 | Tragic 61.0% |
| Immigrants | Trinidad and Tobago | 0.1 /100 | #268 | Tragic 60.7% |
| Immigrants | West Indies | 0.1 /100 | #269 | Tragic 60.6% |
| Cheyenne | 0.1 /100 | #270 | Tragic 60.6% |
| U.S. Virgin Islanders | 0.1 /100 | #271 | Tragic 60.6% |
| Jamaicans | 0.1 /100 | #272 | Tragic 60.5% |
| Chickasaw | 0.1 /100 | #273 | Tragic 60.4% |
| Alaska Natives | 0.1 /100 | #274 | Tragic 60.4% |
| Immigrants | Barbados | 0.1 /100 | #275 | Tragic 60.4% |
| Arapaho | 0.1 /100 | #276 | Tragic 60.3% |
| Bahamians | 0.1 /100 | #277 | Tragic 60.3% |
| Yaqui | 0.1 /100 | #278 | Tragic 60.2% |
| Ute | 0.1 /100 | #279 | Tragic 60.2% |
| Crow | 0.1 /100 | #280 | Tragic 60.2% |
Demographics Similar to Chippewa by College, Under 1 year
In terms of college, under 1 year, the demographic groups most similar to Chippewa are Iroquois (62.6%, a difference of 0.030%), Spanish American (62.6%, a difference of 0.050%), Osage (62.7%, a difference of 0.15%), Immigrants (62.5%, a difference of 0.18%), and Immigrants from Burma/Myanmar (62.5%, a difference of 0.21%).
| Demographics | Rating | Rank | College, Under 1 year |
| Immigrants | Ghana | 3.7 /100 | #227 | Tragic 63.1% |
| Samoans | 3.3 /100 | #228 | Tragic 63.0% |
| Liberians | 3.2 /100 | #229 | Tragic 63.0% |
| Immigrants | Nonimmigrants | 3.0 /100 | #230 | Tragic 62.9% |
| Immigrants | Western Africa | 2.4 /100 | #231 | Tragic 62.8% |
| Osage | 2.2 /100 | #232 | Tragic 62.7% |
| Iroquois | 2.0 /100 | #233 | Tragic 62.6% |
| Chippewa | 2.0 /100 | #234 | Tragic 62.6% |
| Spanish Americans | 1.9 /100 | #235 | Tragic 62.6% |
| Immigrants | Immigrants | 1.7 /100 | #236 | Tragic 62.5% |
| Immigrants | Burma/Myanmar | 1.6 /100 | #237 | Tragic 62.5% |
| French American Indians | 1.5 /100 | #238 | Tragic 62.4% |
| Nepalese | 1.1 /100 | #239 | Tragic 62.2% |
| Aleuts | 1.1 /100 | #240 | Tragic 62.2% |
| Ottawa | 1.1 /100 | #241 | Tragic 62.2% |