Cheyenne vs Haitian Bachelor's Degree
COMPARE
Cheyenne
Haitian
Bachelor's Degree
Bachelor's Degree Comparison
Cheyenne
Haitians
29.4%
BACHELOR'S DEGREE
0.0/ 100
METRIC RATING
310th/ 347
METRIC RANK
31.3%
BACHELOR'S DEGREE
0.1/ 100
METRIC RATING
284th/ 347
METRIC RANK
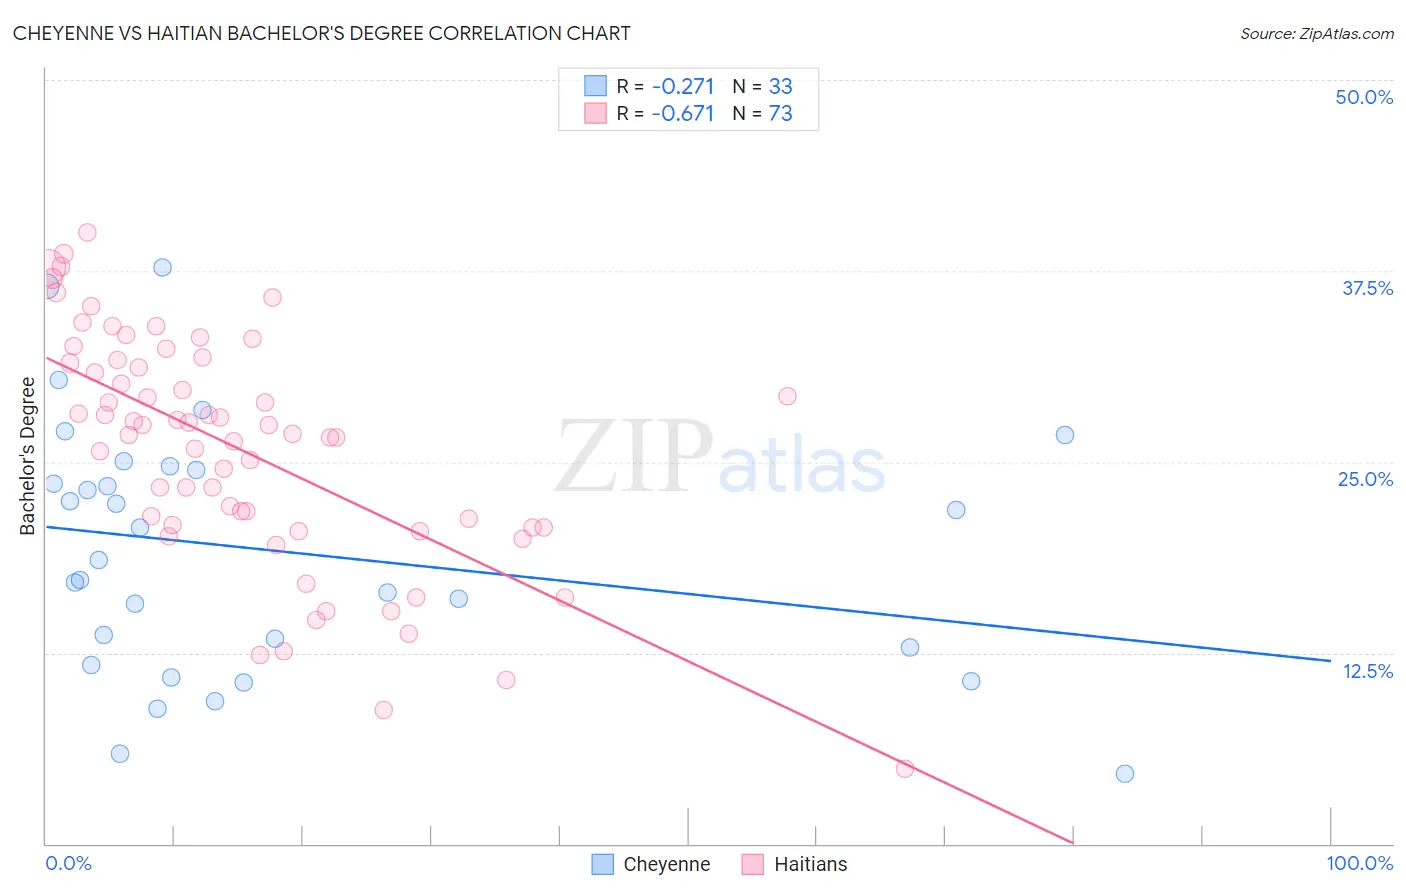
Cheyenne vs Haitian Bachelor's Degree Correlation Chart
The statistical analysis conducted on geographies consisting of 80,718,972 people shows a weak negative correlation between the proportion of Cheyenne and percentage of population with at least bachelor's degree education in the United States with a correlation coefficient (R) of -0.271 and weighted average of 29.4%. Similarly, the statistical analysis conducted on geographies consisting of 287,970,705 people shows a significant negative correlation between the proportion of Haitians and percentage of population with at least bachelor's degree education in the United States with a correlation coefficient (R) of -0.671 and weighted average of 31.3%, a difference of 6.4%.
Bachelor's Degree Correlation Summary
| Measurement | Cheyenne | Haitian |
| Minimum | 4.6% | 4.9% |
| Maximum | 37.7% | 40.1% |
| Range | 33.1% | 35.1% |
| Mean | 19.1% | 25.8% |
| Median | 18.6% | 26.9% |
| Interquartile 25% (IQ1) | 12.3% | 20.7% |
| Interquartile 75% (IQ3) | 24.6% | 31.6% |
| Interquartile Range (IQR) | 12.3% | 10.8% |
| Standard Deviation (Sample) | 8.2% | 7.6% |
| Standard Deviation (Population) | 8.1% | 7.6% |
Similar Demographics by Bachelor's Degree
Demographics Similar to Cheyenne by Bachelor's Degree
In terms of bachelor's degree, the demographic groups most similar to Cheyenne are Choctaw (29.4%, a difference of 0.070%), Seminole (29.4%, a difference of 0.13%), Alaska Native (29.4%, a difference of 0.31%), Hispanic or Latino (29.6%, a difference of 0.47%), and Shoshone (29.3%, a difference of 0.60%).
| Demographics | Rating | Rank | Bachelor's Degree |
| Bangladeshis | 0.0 /100 | #303 | Tragic 30.2% |
| Cherokee | 0.0 /100 | #304 | Tragic 30.2% |
| Immigrants | Latin America | 0.0 /100 | #305 | Tragic 30.1% |
| Immigrants | Yemen | 0.0 /100 | #306 | Tragic 29.9% |
| Nepalese | 0.0 /100 | #307 | Tragic 29.9% |
| Cajuns | 0.0 /100 | #308 | Tragic 29.6% |
| Hispanics or Latinos | 0.0 /100 | #309 | Tragic 29.6% |
| Cheyenne | 0.0 /100 | #310 | Tragic 29.4% |
| Choctaw | 0.0 /100 | #311 | Tragic 29.4% |
| Seminole | 0.0 /100 | #312 | Tragic 29.4% |
| Alaska Natives | 0.0 /100 | #313 | Tragic 29.4% |
| Shoshone | 0.0 /100 | #314 | Tragic 29.3% |
| Immigrants | Cabo Verde | 0.0 /100 | #315 | Tragic 29.2% |
| Sioux | 0.0 /100 | #316 | Tragic 29.1% |
| Colville | 0.0 /100 | #317 | Tragic 29.0% |
Demographics Similar to Haitians by Bachelor's Degree
In terms of bachelor's degree, the demographic groups most similar to Haitians are Aleut (31.3%, a difference of 0.010%), Honduran (31.3%, a difference of 0.030%), Immigrants from El Salvador (31.3%, a difference of 0.070%), Immigrants from Caribbean (31.4%, a difference of 0.31%), and Blackfeet (31.5%, a difference of 0.45%).
| Demographics | Rating | Rank | Bachelor's Degree |
| Dominicans | 0.1 /100 | #277 | Tragic 31.8% |
| Marshallese | 0.1 /100 | #278 | Tragic 31.7% |
| Hawaiians | 0.1 /100 | #279 | Tragic 31.6% |
| Immigrants | Laos | 0.1 /100 | #280 | Tragic 31.6% |
| Blackfeet | 0.1 /100 | #281 | Tragic 31.5% |
| Immigrants | Caribbean | 0.1 /100 | #282 | Tragic 31.4% |
| Hondurans | 0.1 /100 | #283 | Tragic 31.3% |
| Haitians | 0.1 /100 | #284 | Tragic 31.3% |
| Aleuts | 0.1 /100 | #285 | Tragic 31.3% |
| Immigrants | El Salvador | 0.1 /100 | #286 | Tragic 31.3% |
| Ottawa | 0.1 /100 | #287 | Tragic 31.1% |
| Guatemalans | 0.1 /100 | #288 | Tragic 31.0% |
| Puerto Ricans | 0.1 /100 | #289 | Tragic 31.0% |
| Immigrants | Honduras | 0.1 /100 | #290 | Tragic 30.9% |
| Blacks/African Americans | 0.1 /100 | #291 | Tragic 30.9% |