Cheyenne vs Immigrants from Poland Nursery School
COMPARE
Cheyenne
Immigrants from Poland
Nursery School
Nursery School Comparison
Cheyenne
Immigrants from Poland
98.4%
NURSERY SCHOOL
99.6/ 100
METRIC RATING
70th/ 347
METRIC RANK
98.0%
NURSERY SCHOOL
41.3/ 100
METRIC RATING
184th/ 347
METRIC RANK
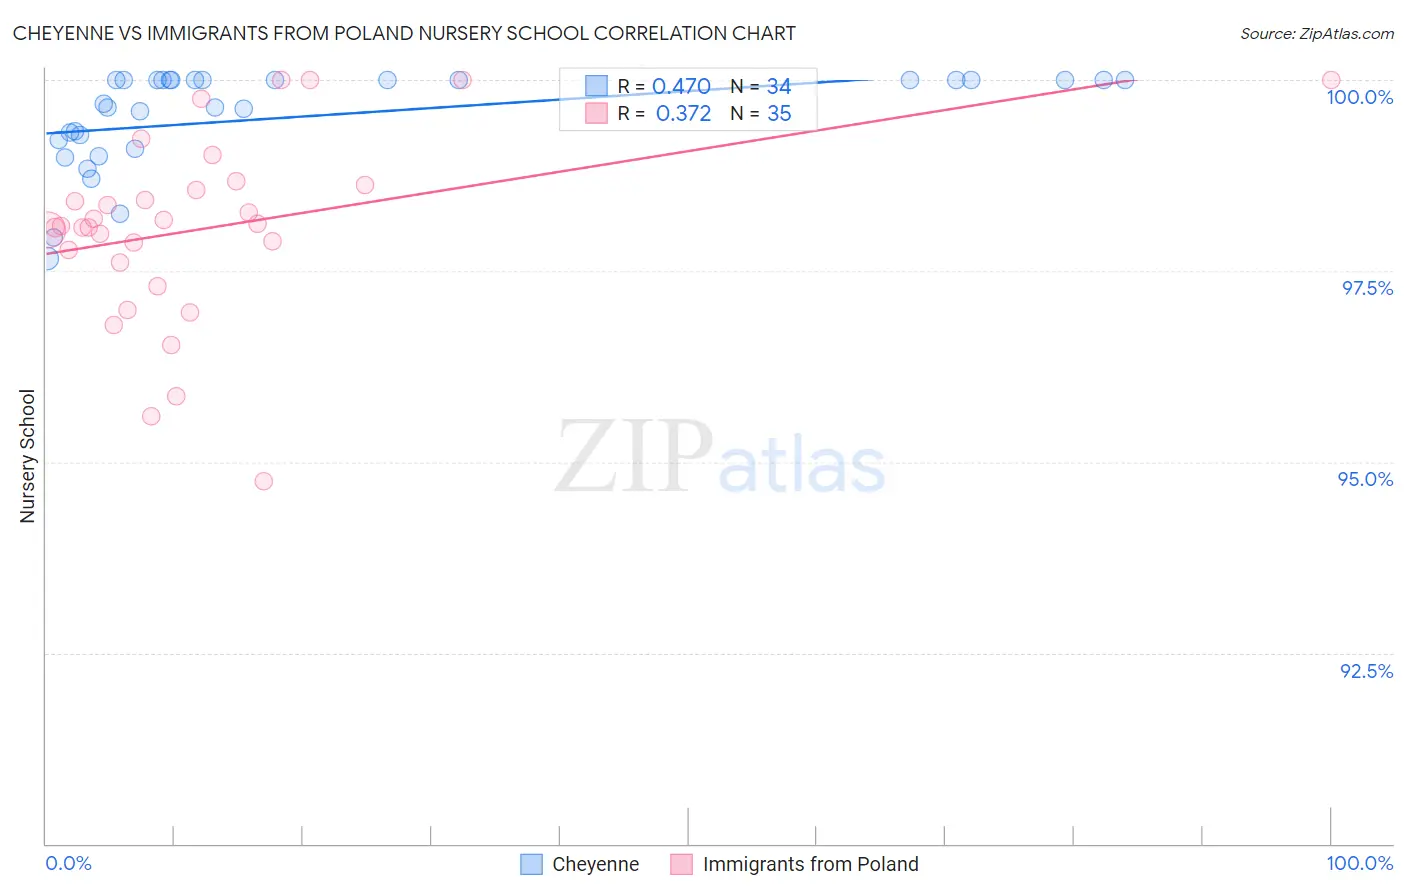
Cheyenne vs Immigrants from Poland Nursery School Correlation Chart
The statistical analysis conducted on geographies consisting of 80,719,411 people shows a moderate positive correlation between the proportion of Cheyenne and percentage of population with at least nursery school education in the United States with a correlation coefficient (R) of 0.470 and weighted average of 98.4%. Similarly, the statistical analysis conducted on geographies consisting of 304,861,559 people shows a mild positive correlation between the proportion of Immigrants from Poland and percentage of population with at least nursery school education in the United States with a correlation coefficient (R) of 0.372 and weighted average of 98.0%, a difference of 0.45%.
Nursery School Correlation Summary
| Measurement | Cheyenne | Immigrants from Poland |
| Minimum | 97.7% | 94.8% |
| Maximum | 100.0% | 100.0% |
| Range | 2.3% | 5.2% |
| Mean | 99.5% | 98.1% |
| Median | 99.8% | 98.1% |
| Interquartile 25% (IQ1) | 99.2% | 97.6% |
| Interquartile 75% (IQ3) | 100.0% | 98.6% |
| Interquartile Range (IQR) | 0.79% | 1.0% |
| Standard Deviation (Sample) | 0.64% | 1.2% |
| Standard Deviation (Population) | 0.63% | 1.2% |
Similar Demographics by Nursery School
Demographics Similar to Cheyenne by Nursery School
In terms of nursery school, the demographic groups most similar to Cheyenne are Immigrants from Northern Europe (98.4%, a difference of 0.0%), Russian (98.4%, a difference of 0.0%), Immigrants from Austria (98.4%, a difference of 0.0%), Serbian (98.4%, a difference of 0.0%), and Canadian (98.4%, a difference of 0.010%).
| Demographics | Rating | Rank | Nursery School |
| Immigrants | North America | 99.7 /100 | #63 | Exceptional 98.4% |
| Greeks | 99.7 /100 | #64 | Exceptional 98.4% |
| Maltese | 99.7 /100 | #65 | Exceptional 98.4% |
| Canadians | 99.7 /100 | #66 | Exceptional 98.4% |
| Immigrants | Northern Europe | 99.6 /100 | #67 | Exceptional 98.4% |
| Russians | 99.6 /100 | #68 | Exceptional 98.4% |
| Immigrants | Austria | 99.6 /100 | #69 | Exceptional 98.4% |
| Cheyenne | 99.6 /100 | #70 | Exceptional 98.4% |
| Serbians | 99.6 /100 | #71 | Exceptional 98.4% |
| Chickasaw | 99.6 /100 | #72 | Exceptional 98.4% |
| Cajuns | 99.4 /100 | #73 | Exceptional 98.4% |
| Immigrants | Netherlands | 99.4 /100 | #74 | Exceptional 98.4% |
| Cherokee | 99.3 /100 | #75 | Exceptional 98.3% |
| Immigrants | England | 99.3 /100 | #76 | Exceptional 98.3% |
| Immigrants | Lithuania | 99.3 /100 | #77 | Exceptional 98.3% |
Demographics Similar to Immigrants from Poland by Nursery School
In terms of nursery school, the demographic groups most similar to Immigrants from Poland are Egyptian (98.0%, a difference of 0.0%), Paiute (98.0%, a difference of 0.0%), Portuguese (98.0%, a difference of 0.0%), Immigrants from Belarus (98.0%, a difference of 0.0%), and Immigrants from Argentina (98.0%, a difference of 0.0%).
| Demographics | Rating | Rank | Nursery School |
| Albanians | 48.9 /100 | #177 | Average 98.0% |
| Natives/Alaskans | 48.6 /100 | #178 | Average 98.0% |
| Argentineans | 46.8 /100 | #179 | Average 98.0% |
| Immigrants | Bosnia and Herzegovina | 45.6 /100 | #180 | Average 98.0% |
| Egyptians | 42.8 /100 | #181 | Average 98.0% |
| Paiute | 42.0 /100 | #182 | Average 98.0% |
| Portuguese | 41.8 /100 | #183 | Average 98.0% |
| Immigrants | Poland | 41.3 /100 | #184 | Average 98.0% |
| Immigrants | Belarus | 41.0 /100 | #185 | Average 98.0% |
| Immigrants | Argentina | 40.8 /100 | #186 | Average 98.0% |
| Immigrants | Kazakhstan | 37.1 /100 | #187 | Fair 97.9% |
| Arabs | 34.7 /100 | #188 | Fair 97.9% |
| Pakistanis | 34.6 /100 | #189 | Fair 97.9% |
| Panamanians | 34.3 /100 | #190 | Fair 97.9% |
| Immigrants | Taiwan | 30.6 /100 | #191 | Fair 97.9% |