Cheyenne vs Immigrants from Zimbabwe Bachelor's Degree
COMPARE
Cheyenne
Immigrants from Zimbabwe
Bachelor's Degree
Bachelor's Degree Comparison
Cheyenne
Immigrants from Zimbabwe
29.4%
BACHELOR'S DEGREE
0.0/ 100
METRIC RATING
310th/ 347
METRIC RANK
42.6%
BACHELOR'S DEGREE
99.4/ 100
METRIC RATING
75th/ 347
METRIC RANK
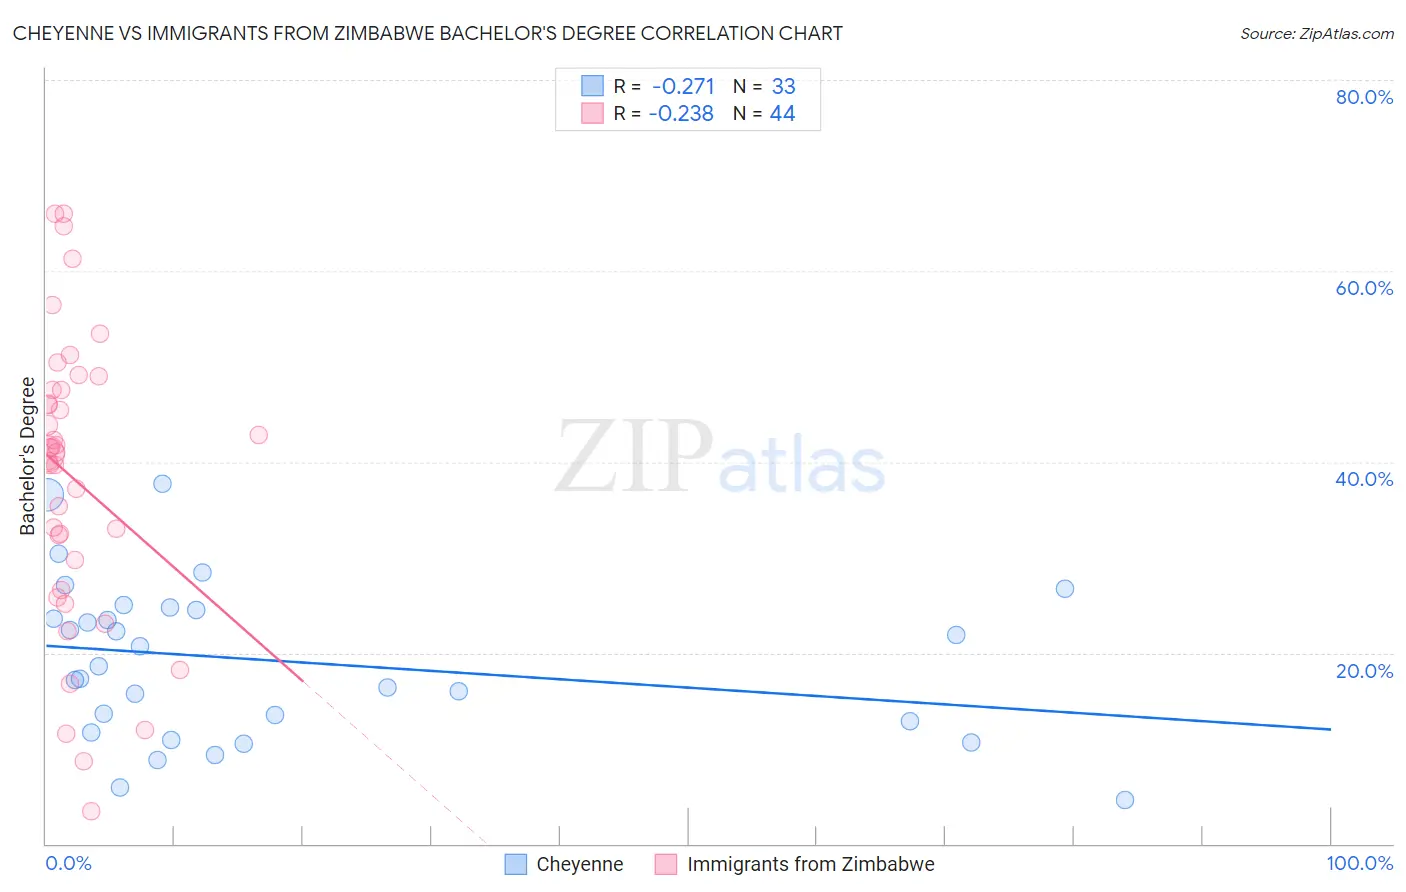
Cheyenne vs Immigrants from Zimbabwe Bachelor's Degree Correlation Chart
The statistical analysis conducted on geographies consisting of 80,718,972 people shows a weak negative correlation between the proportion of Cheyenne and percentage of population with at least bachelor's degree education in the United States with a correlation coefficient (R) of -0.271 and weighted average of 29.4%. Similarly, the statistical analysis conducted on geographies consisting of 117,809,864 people shows a weak negative correlation between the proportion of Immigrants from Zimbabwe and percentage of population with at least bachelor's degree education in the United States with a correlation coefficient (R) of -0.238 and weighted average of 42.6%, a difference of 44.6%.
Bachelor's Degree Correlation Summary
| Measurement | Cheyenne | Immigrants from Zimbabwe |
| Minimum | 4.6% | 3.5% |
| Maximum | 37.7% | 66.0% |
| Range | 33.1% | 62.5% |
| Mean | 19.1% | 38.2% |
| Median | 18.6% | 40.9% |
| Interquartile 25% (IQ1) | 12.3% | 28.1% |
| Interquartile 75% (IQ3) | 24.6% | 47.5% |
| Interquartile Range (IQR) | 12.3% | 19.4% |
| Standard Deviation (Sample) | 8.2% | 15.1% |
| Standard Deviation (Population) | 8.1% | 15.0% |
Similar Demographics by Bachelor's Degree
Demographics Similar to Cheyenne by Bachelor's Degree
In terms of bachelor's degree, the demographic groups most similar to Cheyenne are Choctaw (29.4%, a difference of 0.070%), Seminole (29.4%, a difference of 0.13%), Alaska Native (29.4%, a difference of 0.31%), Hispanic or Latino (29.6%, a difference of 0.47%), and Shoshone (29.3%, a difference of 0.60%).
| Demographics | Rating | Rank | Bachelor's Degree |
| Bangladeshis | 0.0 /100 | #303 | Tragic 30.2% |
| Cherokee | 0.0 /100 | #304 | Tragic 30.2% |
| Immigrants | Latin America | 0.0 /100 | #305 | Tragic 30.1% |
| Immigrants | Yemen | 0.0 /100 | #306 | Tragic 29.9% |
| Nepalese | 0.0 /100 | #307 | Tragic 29.9% |
| Cajuns | 0.0 /100 | #308 | Tragic 29.6% |
| Hispanics or Latinos | 0.0 /100 | #309 | Tragic 29.6% |
| Cheyenne | 0.0 /100 | #310 | Tragic 29.4% |
| Choctaw | 0.0 /100 | #311 | Tragic 29.4% |
| Seminole | 0.0 /100 | #312 | Tragic 29.4% |
| Alaska Natives | 0.0 /100 | #313 | Tragic 29.4% |
| Shoshone | 0.0 /100 | #314 | Tragic 29.3% |
| Immigrants | Cabo Verde | 0.0 /100 | #315 | Tragic 29.2% |
| Sioux | 0.0 /100 | #316 | Tragic 29.1% |
| Colville | 0.0 /100 | #317 | Tragic 29.0% |
Demographics Similar to Immigrants from Zimbabwe by Bachelor's Degree
In terms of bachelor's degree, the demographic groups most similar to Immigrants from Zimbabwe are Immigrants from Egypt (42.6%, a difference of 0.020%), Immigrants from Eastern Europe (42.5%, a difference of 0.20%), Bhutanese (42.7%, a difference of 0.21%), Immigrants from Ethiopia (42.5%, a difference of 0.26%), and Immigrants from Lebanon (42.4%, a difference of 0.42%).
| Demographics | Rating | Rank | Bachelor's Degree |
| Immigrants | Indonesia | 99.7 /100 | #68 | Exceptional 43.3% |
| Immigrants | Pakistan | 99.7 /100 | #69 | Exceptional 43.1% |
| Immigrants | Romania | 99.6 /100 | #70 | Exceptional 42.9% |
| Immigrants | Argentina | 99.6 /100 | #71 | Exceptional 42.8% |
| Ethiopians | 99.5 /100 | #72 | Exceptional 42.8% |
| Immigrants | Uzbekistan | 99.5 /100 | #73 | Exceptional 42.8% |
| Bhutanese | 99.5 /100 | #74 | Exceptional 42.7% |
| Immigrants | Zimbabwe | 99.4 /100 | #75 | Exceptional 42.6% |
| Immigrants | Egypt | 99.4 /100 | #76 | Exceptional 42.6% |
| Immigrants | Eastern Europe | 99.4 /100 | #77 | Exceptional 42.5% |
| Immigrants | Ethiopia | 99.4 /100 | #78 | Exceptional 42.5% |
| Immigrants | Lebanon | 99.3 /100 | #79 | Exceptional 42.4% |
| Immigrants | Croatia | 99.2 /100 | #80 | Exceptional 42.3% |
| Immigrants | Hungary | 99.2 /100 | #81 | Exceptional 42.3% |
| Immigrants | Scotland | 99.2 /100 | #82 | Exceptional 42.3% |