Cheyenne vs Immigrants from Korea College, 1 year or more
COMPARE
Cheyenne
Immigrants from Korea
College, 1 year or more
College, 1 year or more Comparison
Cheyenne
Immigrants from Korea
54.1%
COLLEGE, 1 YEAR OR MORE
0.1/ 100
METRIC RATING
280th/ 347
METRIC RANK
66.5%
COLLEGE, 1 YEAR OR MORE
100.0/ 100
METRIC RATING
20th/ 347
METRIC RANK
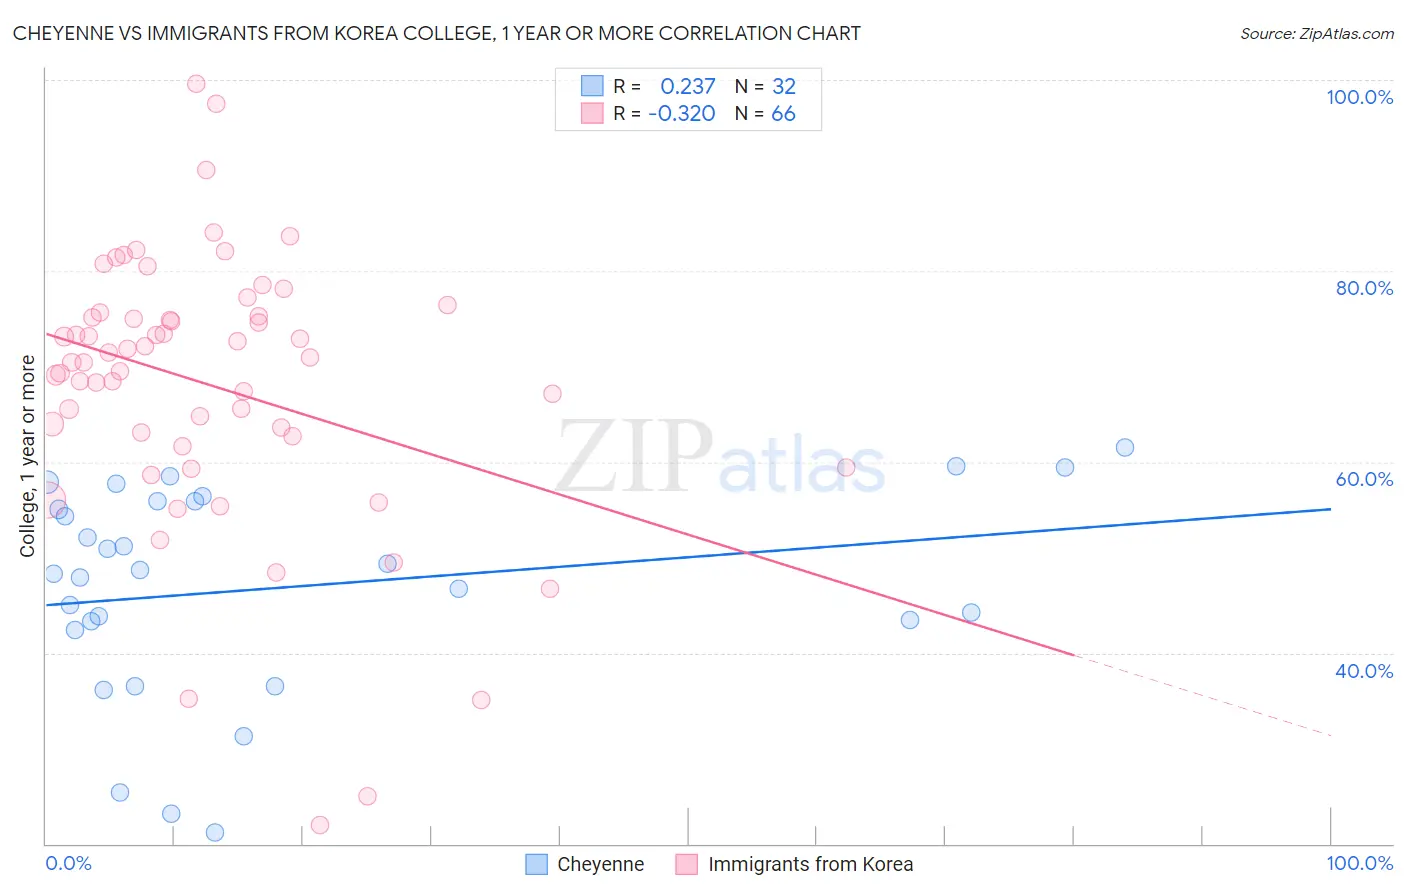
Cheyenne vs Immigrants from Korea College, 1 year or more Correlation Chart
The statistical analysis conducted on geographies consisting of 80,719,187 people shows a weak positive correlation between the proportion of Cheyenne and percentage of population with at least college, 1 year or more education in the United States with a correlation coefficient (R) of 0.237 and weighted average of 54.1%. Similarly, the statistical analysis conducted on geographies consisting of 416,335,693 people shows a mild negative correlation between the proportion of Immigrants from Korea and percentage of population with at least college, 1 year or more education in the United States with a correlation coefficient (R) of -0.320 and weighted average of 66.5%, a difference of 22.9%.
College, 1 year or more Correlation Summary
| Measurement | Cheyenne | Immigrants from Korea |
| Minimum | 21.1% | 22.0% |
| Maximum | 61.5% | 99.6% |
| Range | 40.3% | 77.6% |
| Mean | 46.8% | 68.0% |
| Median | 48.5% | 70.7% |
| Interquartile 25% (IQ1) | 42.9% | 62.6% |
| Interquartile 75% (IQ3) | 55.9% | 75.2% |
| Interquartile Range (IQR) | 13.0% | 12.6% |
| Standard Deviation (Sample) | 10.9% | 14.4% |
| Standard Deviation (Population) | 10.7% | 14.3% |
Similar Demographics by College, 1 year or more
Demographics Similar to Cheyenne by College, 1 year or more
In terms of college, 1 year or more, the demographic groups most similar to Cheyenne are Colville (54.1%, a difference of 0.010%), Guyanese (54.1%, a difference of 0.050%), Arapaho (54.1%, a difference of 0.060%), Immigrants from Jamaica (54.2%, a difference of 0.070%), and Ecuadorian (54.3%, a difference of 0.39%).
| Demographics | Rating | Rank | College, 1 year or more |
| Immigrants | Grenada | 0.2 /100 | #273 | Tragic 54.4% |
| Belizeans | 0.2 /100 | #274 | Tragic 54.4% |
| Americans | 0.2 /100 | #275 | Tragic 54.4% |
| Shoshone | 0.2 /100 | #276 | Tragic 54.3% |
| Ecuadorians | 0.2 /100 | #277 | Tragic 54.3% |
| Immigrants | Jamaica | 0.1 /100 | #278 | Tragic 54.2% |
| Arapaho | 0.1 /100 | #279 | Tragic 54.1% |
| Cheyenne | 0.1 /100 | #280 | Tragic 54.1% |
| Colville | 0.1 /100 | #281 | Tragic 54.1% |
| Guyanese | 0.1 /100 | #282 | Tragic 54.1% |
| Nicaraguans | 0.1 /100 | #283 | Tragic 53.9% |
| Ute | 0.1 /100 | #284 | Tragic 53.8% |
| Immigrants | Guyana | 0.1 /100 | #285 | Tragic 53.5% |
| Central American Indians | 0.1 /100 | #286 | Tragic 53.5% |
| Immigrants | Belize | 0.1 /100 | #287 | Tragic 53.5% |
Demographics Similar to Immigrants from Korea by College, 1 year or more
In terms of college, 1 year or more, the demographic groups most similar to Immigrants from Korea are Immigrants from Switzerland (66.5%, a difference of 0.040%), Immigrants from Hong Kong (66.4%, a difference of 0.070%), Eastern European (66.6%, a difference of 0.090%), Soviet Union (66.4%, a difference of 0.13%), and Immigrants from Eastern Asia (66.6%, a difference of 0.17%).
| Demographics | Rating | Rank | College, 1 year or more |
| Immigrants | Sweden | 100.0 /100 | #13 | Exceptional 66.8% |
| Burmese | 100.0 /100 | #14 | Exceptional 66.7% |
| Cambodians | 100.0 /100 | #15 | Exceptional 66.7% |
| Immigrants | Japan | 100.0 /100 | #16 | Exceptional 66.7% |
| Immigrants | Eastern Asia | 100.0 /100 | #17 | Exceptional 66.6% |
| Eastern Europeans | 100.0 /100 | #18 | Exceptional 66.6% |
| Immigrants | Switzerland | 100.0 /100 | #19 | Exceptional 66.5% |
| Immigrants | Korea | 100.0 /100 | #20 | Exceptional 66.5% |
| Immigrants | Hong Kong | 100.0 /100 | #21 | Exceptional 66.4% |
| Soviet Union | 100.0 /100 | #22 | Exceptional 66.4% |
| Immigrants | China | 100.0 /100 | #23 | Exceptional 66.4% |
| Immigrants | Belgium | 100.0 /100 | #24 | Exceptional 66.3% |
| Indians (Asian) | 100.0 /100 | #25 | Exceptional 66.1% |
| Latvians | 100.0 /100 | #26 | Exceptional 66.1% |
| Immigrants | Ireland | 100.0 /100 | #27 | Exceptional 65.9% |