Cheyenne vs Immigrants from Guatemala College, 1 year or more
COMPARE
Cheyenne
Immigrants from Guatemala
College, 1 year or more
College, 1 year or more Comparison
Cheyenne
Immigrants from Guatemala
54.1%
COLLEGE, 1 YEAR OR MORE
0.1/ 100
METRIC RATING
280th/ 347
METRIC RANK
50.7%
COLLEGE, 1 YEAR OR MORE
0.0/ 100
METRIC RATING
323rd/ 347
METRIC RANK
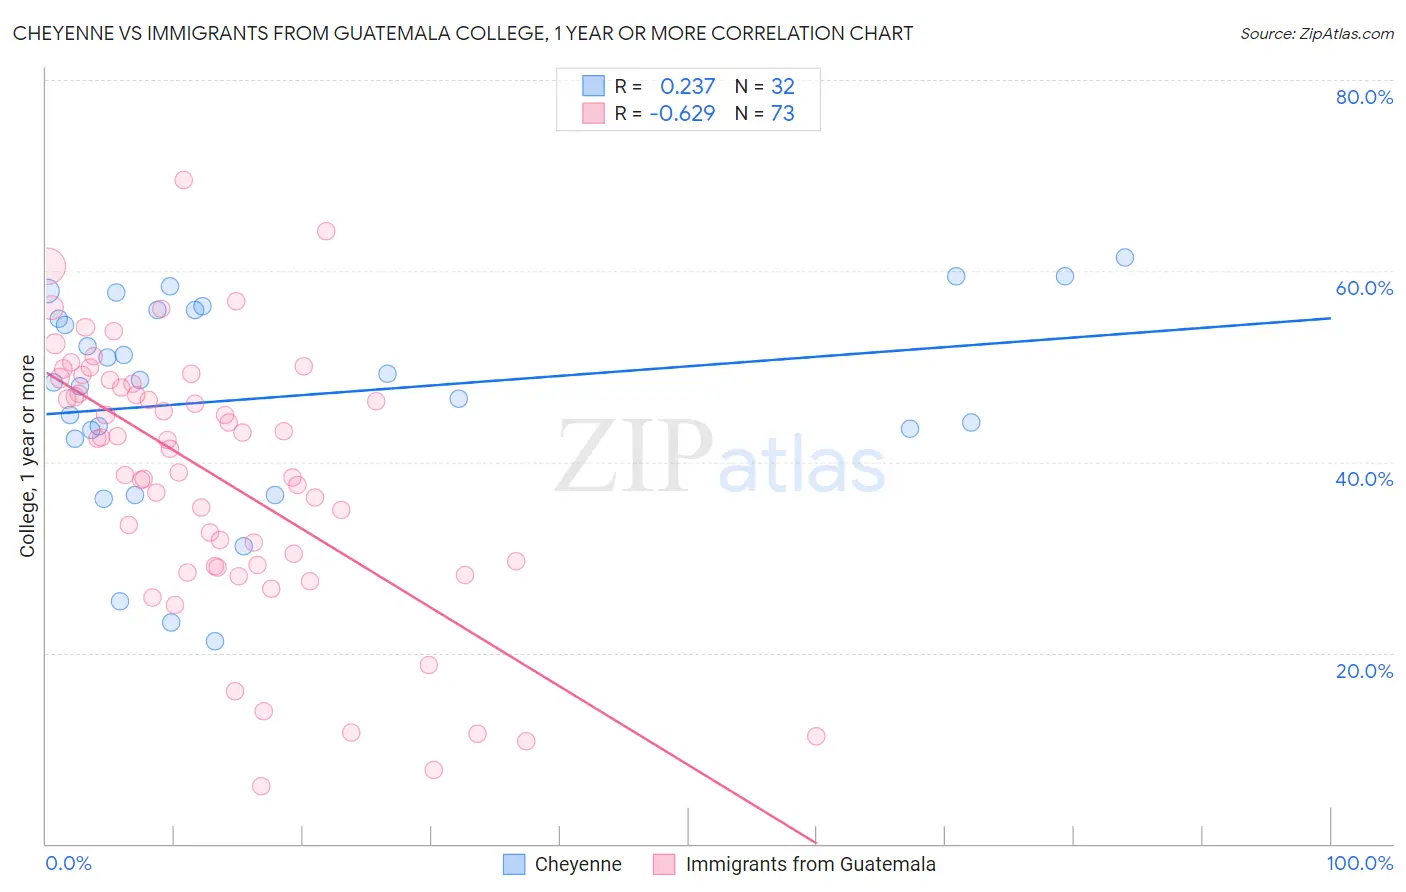
Cheyenne vs Immigrants from Guatemala College, 1 year or more Correlation Chart
The statistical analysis conducted on geographies consisting of 80,719,187 people shows a weak positive correlation between the proportion of Cheyenne and percentage of population with at least college, 1 year or more education in the United States with a correlation coefficient (R) of 0.237 and weighted average of 54.1%. Similarly, the statistical analysis conducted on geographies consisting of 377,285,447 people shows a significant negative correlation between the proportion of Immigrants from Guatemala and percentage of population with at least college, 1 year or more education in the United States with a correlation coefficient (R) of -0.629 and weighted average of 50.7%, a difference of 6.7%.
College, 1 year or more Correlation Summary
| Measurement | Cheyenne | Immigrants from Guatemala |
| Minimum | 21.1% | 6.0% |
| Maximum | 61.5% | 69.5% |
| Range | 40.3% | 63.5% |
| Mean | 46.8% | 38.6% |
| Median | 48.5% | 42.3% |
| Interquartile 25% (IQ1) | 42.9% | 29.2% |
| Interquartile 75% (IQ3) | 55.9% | 48.4% |
| Interquartile Range (IQR) | 13.0% | 19.2% |
| Standard Deviation (Sample) | 10.9% | 13.8% |
| Standard Deviation (Population) | 10.7% | 13.7% |
Similar Demographics by College, 1 year or more
Demographics Similar to Cheyenne by College, 1 year or more
In terms of college, 1 year or more, the demographic groups most similar to Cheyenne are Colville (54.1%, a difference of 0.010%), Guyanese (54.1%, a difference of 0.050%), Arapaho (54.1%, a difference of 0.060%), Immigrants from Jamaica (54.2%, a difference of 0.070%), and Ecuadorian (54.3%, a difference of 0.39%).
| Demographics | Rating | Rank | College, 1 year or more |
| Immigrants | Grenada | 0.2 /100 | #273 | Tragic 54.4% |
| Belizeans | 0.2 /100 | #274 | Tragic 54.4% |
| Americans | 0.2 /100 | #275 | Tragic 54.4% |
| Shoshone | 0.2 /100 | #276 | Tragic 54.3% |
| Ecuadorians | 0.2 /100 | #277 | Tragic 54.3% |
| Immigrants | Jamaica | 0.1 /100 | #278 | Tragic 54.2% |
| Arapaho | 0.1 /100 | #279 | Tragic 54.1% |
| Cheyenne | 0.1 /100 | #280 | Tragic 54.1% |
| Colville | 0.1 /100 | #281 | Tragic 54.1% |
| Guyanese | 0.1 /100 | #282 | Tragic 54.1% |
| Nicaraguans | 0.1 /100 | #283 | Tragic 53.9% |
| Ute | 0.1 /100 | #284 | Tragic 53.8% |
| Immigrants | Guyana | 0.1 /100 | #285 | Tragic 53.5% |
| Central American Indians | 0.1 /100 | #286 | Tragic 53.5% |
| Immigrants | Belize | 0.1 /100 | #287 | Tragic 53.5% |
Demographics Similar to Immigrants from Guatemala by College, 1 year or more
In terms of college, 1 year or more, the demographic groups most similar to Immigrants from Guatemala are Immigrants from Cuba (50.7%, a difference of 0.010%), Immigrants from Latin America (50.7%, a difference of 0.040%), Dominican (50.6%, a difference of 0.22%), Navajo (50.8%, a difference of 0.23%), and Menominee (50.6%, a difference of 0.26%).
| Demographics | Rating | Rank | College, 1 year or more |
| Cajuns | 0.0 /100 | #316 | Tragic 51.2% |
| Hispanics or Latinos | 0.0 /100 | #317 | Tragic 51.1% |
| Immigrants | Honduras | 0.0 /100 | #318 | Tragic 51.0% |
| Immigrants | El Salvador | 0.0 /100 | #319 | Tragic 51.0% |
| Kiowa | 0.0 /100 | #320 | Tragic 51.0% |
| Hopi | 0.0 /100 | #321 | Tragic 50.9% |
| Navajo | 0.0 /100 | #322 | Tragic 50.8% |
| Immigrants | Guatemala | 0.0 /100 | #323 | Tragic 50.7% |
| Immigrants | Cuba | 0.0 /100 | #324 | Tragic 50.7% |
| Immigrants | Latin America | 0.0 /100 | #325 | Tragic 50.7% |
| Dominicans | 0.0 /100 | #326 | Tragic 50.6% |
| Menominee | 0.0 /100 | #327 | Tragic 50.6% |
| Dutch West Indians | 0.0 /100 | #328 | Tragic 50.5% |
| Cape Verdeans | 0.0 /100 | #329 | Tragic 50.3% |
| Natives/Alaskans | 0.0 /100 | #330 | Tragic 50.2% |