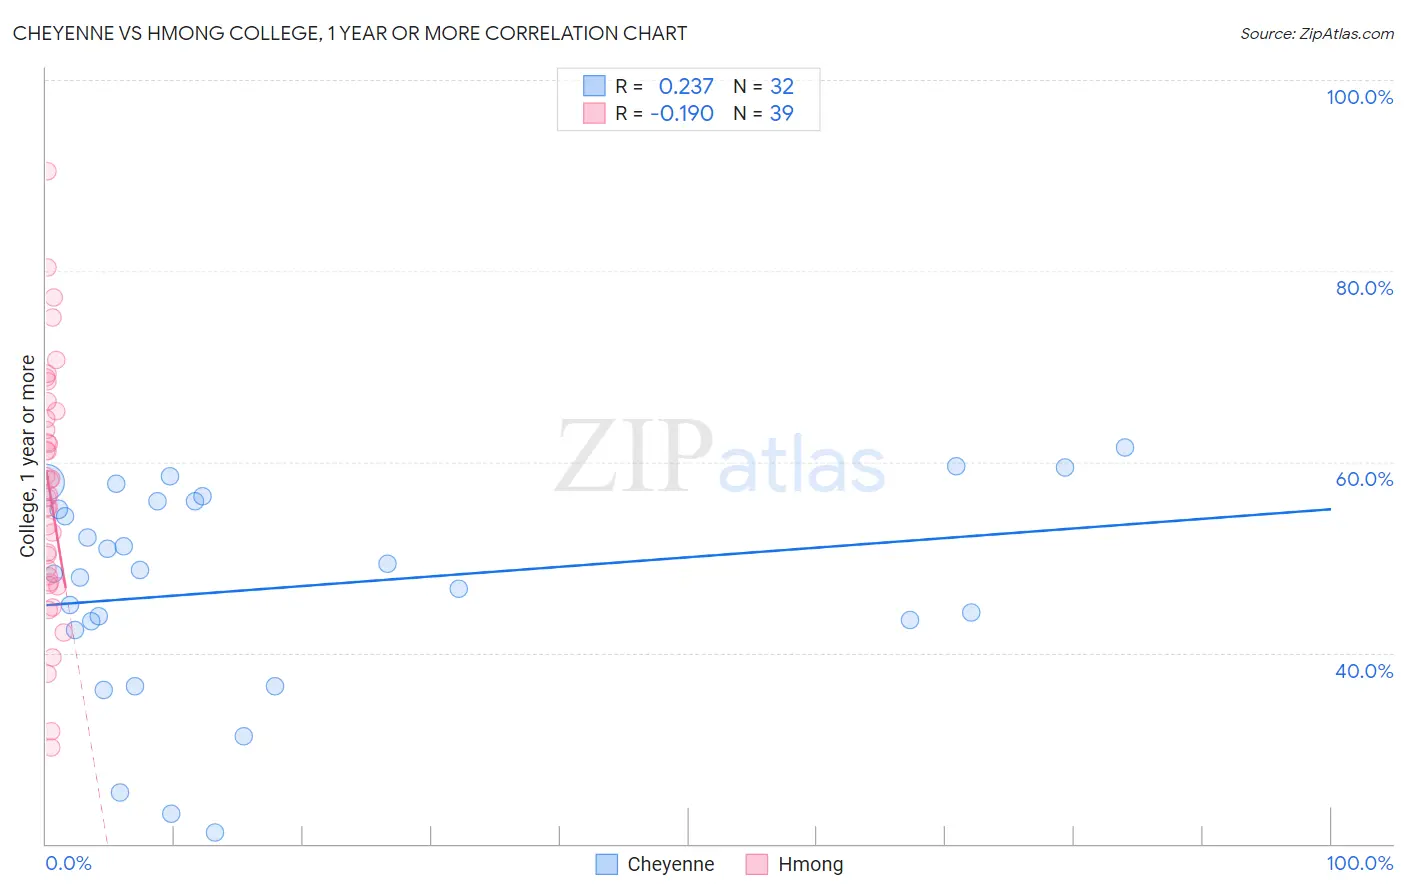
Cheyenne vs Hmong College, 1 year or more
COMPARE
Cheyenne
Hmong
College, 1 year or more
College, 1 year or more Comparison
Cheyenne
Hmong
54.1%
COLLEGE, 1 YEAR OR MORE
0.1/ 100
METRIC RATING
280th/ 347
METRIC RANK
57.2%
COLLEGE, 1 YEAR OR MORE
5.4/ 100
METRIC RATING
224th/ 347
METRIC RANK
Cheyenne vs Hmong College, 1 year or more Correlation Chart
The statistical analysis conducted on geographies consisting of 80,719,187 people shows a weak positive correlation between the proportion of Cheyenne and percentage of population with at least college, 1 year or more education in the United States with a correlation coefficient (R) of 0.237 and weighted average of 54.1%. Similarly, the statistical analysis conducted on geographies consisting of 24,680,511 people shows a poor negative correlation between the proportion of Hmong and percentage of population with at least college, 1 year or more education in the United States with a correlation coefficient (R) of -0.190 and weighted average of 57.2%, a difference of 5.6%.
College, 1 year or more Correlation Summary
| Measurement | Cheyenne | Hmong |
| Minimum | 21.1% | 30.1% |
| Maximum | 61.5% | 90.4% |
| Range | 40.3% | 60.4% |
| Mean | 46.8% | 56.9% |
| Median | 48.5% | 56.5% |
| Interquartile 25% (IQ1) | 42.9% | 47.3% |
| Interquartile 75% (IQ3) | 55.9% | 65.3% |
| Interquartile Range (IQR) | 13.0% | 18.0% |
| Standard Deviation (Sample) | 10.9% | 13.1% |
| Standard Deviation (Population) | 10.7% | 12.9% |
Similar Demographics by College, 1 year or more
Demographics Similar to Cheyenne by College, 1 year or more
In terms of college, 1 year or more, the demographic groups most similar to Cheyenne are Colville (54.1%, a difference of 0.010%), Guyanese (54.1%, a difference of 0.050%), Arapaho (54.1%, a difference of 0.060%), Immigrants from Jamaica (54.2%, a difference of 0.070%), and Ecuadorian (54.3%, a difference of 0.39%).
| Demographics | Rating | Rank | College, 1 year or more |
| Immigrants | Grenada | 0.2 /100 | #273 | Tragic 54.4% |
| Belizeans | 0.2 /100 | #274 | Tragic 54.4% |
| Americans | 0.2 /100 | #275 | Tragic 54.4% |
| Shoshone | 0.2 /100 | #276 | Tragic 54.3% |
| Ecuadorians | 0.2 /100 | #277 | Tragic 54.3% |
| Immigrants | Jamaica | 0.1 /100 | #278 | Tragic 54.2% |
| Arapaho | 0.1 /100 | #279 | Tragic 54.1% |
| Cheyenne | 0.1 /100 | #280 | Tragic 54.1% |
| Colville | 0.1 /100 | #281 | Tragic 54.1% |
| Guyanese | 0.1 /100 | #282 | Tragic 54.1% |
| Nicaraguans | 0.1 /100 | #283 | Tragic 53.9% |
| Ute | 0.1 /100 | #284 | Tragic 53.8% |
| Immigrants | Guyana | 0.1 /100 | #285 | Tragic 53.5% |
| Central American Indians | 0.1 /100 | #286 | Tragic 53.5% |
| Immigrants | Belize | 0.1 /100 | #287 | Tragic 53.5% |
Demographics Similar to Hmong by College, 1 year or more
In terms of college, 1 year or more, the demographic groups most similar to Hmong are Portuguese (57.2%, a difference of 0.0%), Subsaharan African (57.3%, a difference of 0.17%), Vietnamese (57.0%, a difference of 0.21%), Immigrants from Western Africa (57.0%, a difference of 0.23%), and Immigrants (57.0%, a difference of 0.30%).
| Demographics | Rating | Rank | College, 1 year or more |
| Immigrants | Panama | 9.1 /100 | #217 | Tragic 57.6% |
| Native Hawaiians | 9.0 /100 | #218 | Tragic 57.6% |
| Whites/Caucasians | 8.7 /100 | #219 | Tragic 57.6% |
| Immigrants | Costa Rica | 8.0 /100 | #220 | Tragic 57.5% |
| Immigrants | Ghana | 7.7 /100 | #221 | Tragic 57.4% |
| Sub-Saharan Africans | 6.1 /100 | #222 | Tragic 57.3% |
| Portuguese | 5.4 /100 | #223 | Tragic 57.2% |
| Hmong | 5.4 /100 | #224 | Tragic 57.2% |
| Vietnamese | 4.7 /100 | #225 | Tragic 57.0% |
| Immigrants | Western Africa | 4.6 /100 | #226 | Tragic 57.0% |
| Immigrants | Immigrants | 4.4 /100 | #227 | Tragic 57.0% |
| Immigrants | Fiji | 4.0 /100 | #228 | Tragic 56.9% |
| Cree | 3.6 /100 | #229 | Tragic 56.8% |
| Liberians | 3.1 /100 | #230 | Tragic 56.7% |
| Immigrants | Burma/Myanmar | 2.7 /100 | #231 | Tragic 56.6% |