Immigrants from Sudan vs Senegalese College, Under 1 year
COMPARE
Immigrants from Sudan
Senegalese
College, Under 1 year
College, Under 1 year Comparison
Immigrants from Sudan
Senegalese
66.2%
COLLEGE, UNDER 1 YEAR
76.0/ 100
METRIC RATING
151st/ 347
METRIC RANK
63.6%
COLLEGE, UNDER 1 YEAR
7.7/ 100
METRIC RATING
215th/ 347
METRIC RANK
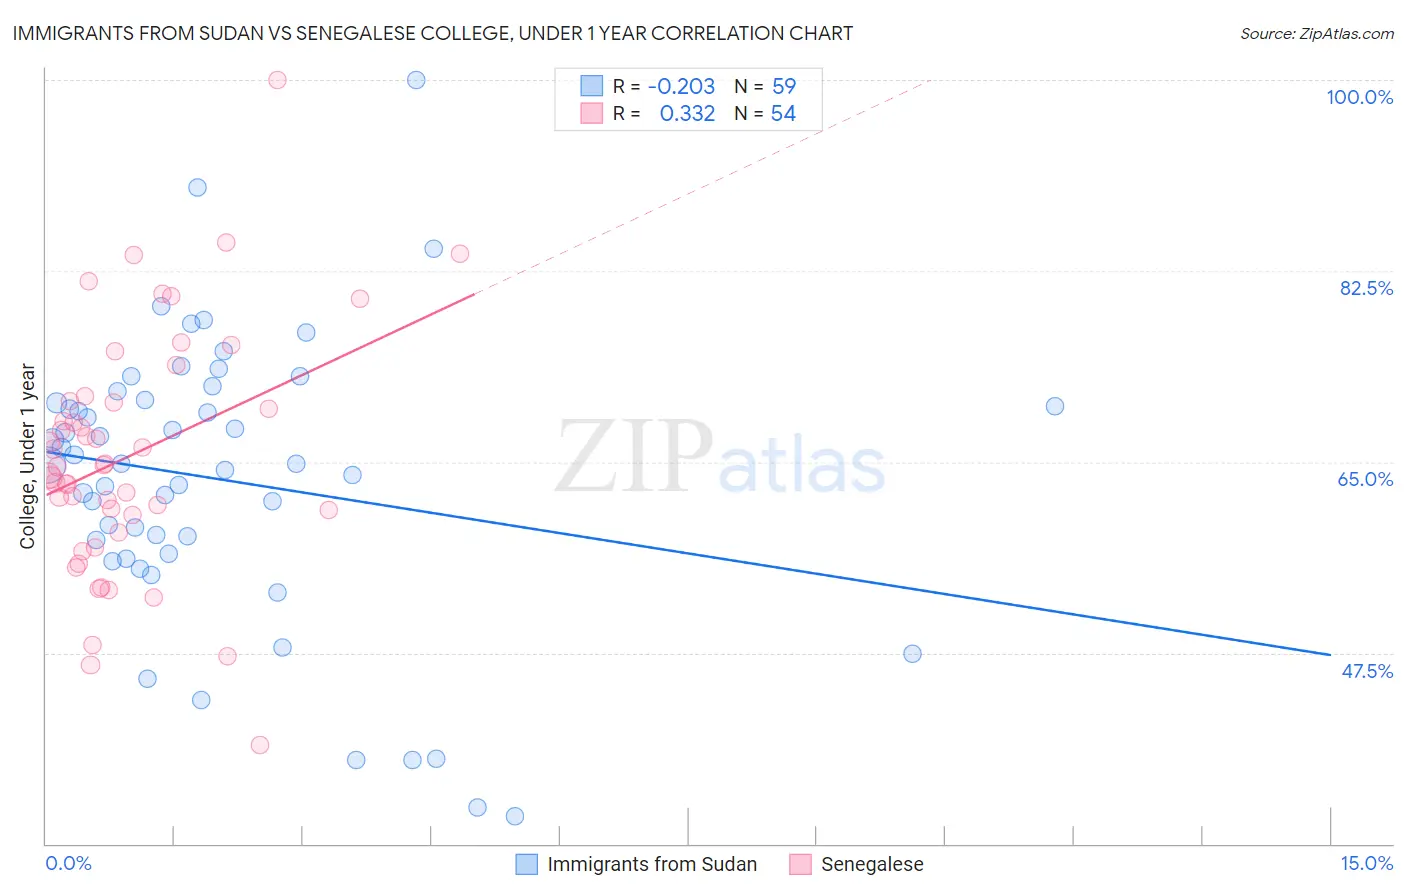
Immigrants from Sudan vs Senegalese College, Under 1 year Correlation Chart
The statistical analysis conducted on geographies consisting of 118,973,526 people shows a weak negative correlation between the proportion of Immigrants from Sudan and percentage of population with at least college, under 1 year education in the United States with a correlation coefficient (R) of -0.203 and weighted average of 66.2%. Similarly, the statistical analysis conducted on geographies consisting of 78,142,569 people shows a mild positive correlation between the proportion of Senegalese and percentage of population with at least college, under 1 year education in the United States with a correlation coefficient (R) of 0.332 and weighted average of 63.6%, a difference of 4.1%.
College, Under 1 year Correlation Summary
| Measurement | Immigrants from Sudan | Senegalese |
| Minimum | 32.5% | 39.1% |
| Maximum | 100.0% | 100.0% |
| Range | 67.5% | 60.9% |
| Mean | 63.4% | 65.6% |
| Median | 64.8% | 64.7% |
| Interquartile 25% (IQ1) | 56.6% | 60.2% |
| Interquartile 75% (IQ3) | 70.7% | 70.5% |
| Interquartile Range (IQR) | 14.1% | 10.4% |
| Standard Deviation (Sample) | 13.2% | 11.1% |
| Standard Deviation (Population) | 13.0% | 11.0% |
Similar Demographics by College, Under 1 year
Demographics Similar to Immigrants from Sudan by College, Under 1 year
In terms of college, under 1 year, the demographic groups most similar to Immigrants from Sudan are Immigrants from Iraq (66.3%, a difference of 0.070%), Sudanese (66.2%, a difference of 0.11%), Immigrants from Venezuela (66.3%, a difference of 0.12%), Belgian (66.2%, a difference of 0.13%), and Taiwanese (66.4%, a difference of 0.16%).
| Demographics | Rating | Rank | College, Under 1 year |
| Immigrants | Germany | 82.0 /100 | #144 | Excellent 66.5% |
| Immigrants | Kenya | 81.8 /100 | #145 | Excellent 66.5% |
| Kenyans | 81.7 /100 | #146 | Excellent 66.5% |
| Immigrants | Morocco | 81.7 /100 | #147 | Excellent 66.5% |
| Taiwanese | 78.6 /100 | #148 | Good 66.4% |
| Immigrants | Venezuela | 77.9 /100 | #149 | Good 66.3% |
| Immigrants | Iraq | 77.1 /100 | #150 | Good 66.3% |
| Immigrants | Sudan | 76.0 /100 | #151 | Good 66.2% |
| Sudanese | 74.1 /100 | #152 | Good 66.2% |
| Belgians | 73.7 /100 | #153 | Good 66.2% |
| Immigrants | Eritrea | 71.9 /100 | #154 | Good 66.1% |
| Irish | 70.3 /100 | #155 | Good 66.0% |
| Welsh | 69.9 /100 | #156 | Good 66.0% |
| Sierra Leoneans | 67.8 /100 | #157 | Good 66.0% |
| Celtics | 67.3 /100 | #158 | Good 65.9% |
Demographics Similar to Senegalese by College, Under 1 year
In terms of college, under 1 year, the demographic groups most similar to Senegalese are Hmong (63.5%, a difference of 0.15%), Immigrants from Nigeria (63.7%, a difference of 0.17%), Immigrants from South America (63.8%, a difference of 0.21%), Immigrants from Uruguay (63.4%, a difference of 0.34%), and Immigrants from Panama (63.4%, a difference of 0.36%).
| Demographics | Rating | Rank | College, Under 1 year |
| Immigrants | Vietnam | 12.1 /100 | #208 | Poor 64.0% |
| Puget Sound Salish | 11.3 /100 | #209 | Poor 63.9% |
| Ghanaians | 11.2 /100 | #210 | Poor 63.9% |
| Native Hawaiians | 10.6 /100 | #211 | Poor 63.9% |
| Immigrants | Middle Africa | 10.5 /100 | #212 | Poor 63.9% |
| Immigrants | South America | 9.1 /100 | #213 | Tragic 63.8% |
| Immigrants | Nigeria | 8.8 /100 | #214 | Tragic 63.7% |
| Senegalese | 7.7 /100 | #215 | Tragic 63.6% |
| Hmong | 6.8 /100 | #216 | Tragic 63.5% |
| Immigrants | Uruguay | 5.8 /100 | #217 | Tragic 63.4% |
| Immigrants | Panama | 5.7 /100 | #218 | Tragic 63.4% |
| Immigrants | Fiji | 5.7 /100 | #219 | Tragic 63.4% |
| Portuguese | 5.6 /100 | #220 | Tragic 63.4% |
| Cree | 5.2 /100 | #221 | Tragic 63.3% |
| Immigrants | Senegal | 5.0 /100 | #222 | Tragic 63.3% |