Slovene vs Indonesian College, Under 1 year
COMPARE
Slovene
Indonesian
College, Under 1 year
College, Under 1 year Comparison
Slovenes
Indonesians
67.3%
COLLEGE, UNDER 1 YEAR
93.3/ 100
METRIC RATING
121st/ 347
METRIC RANK
61.2%
COLLEGE, UNDER 1 YEAR
0.3/ 100
METRIC RATING
259th/ 347
METRIC RANK
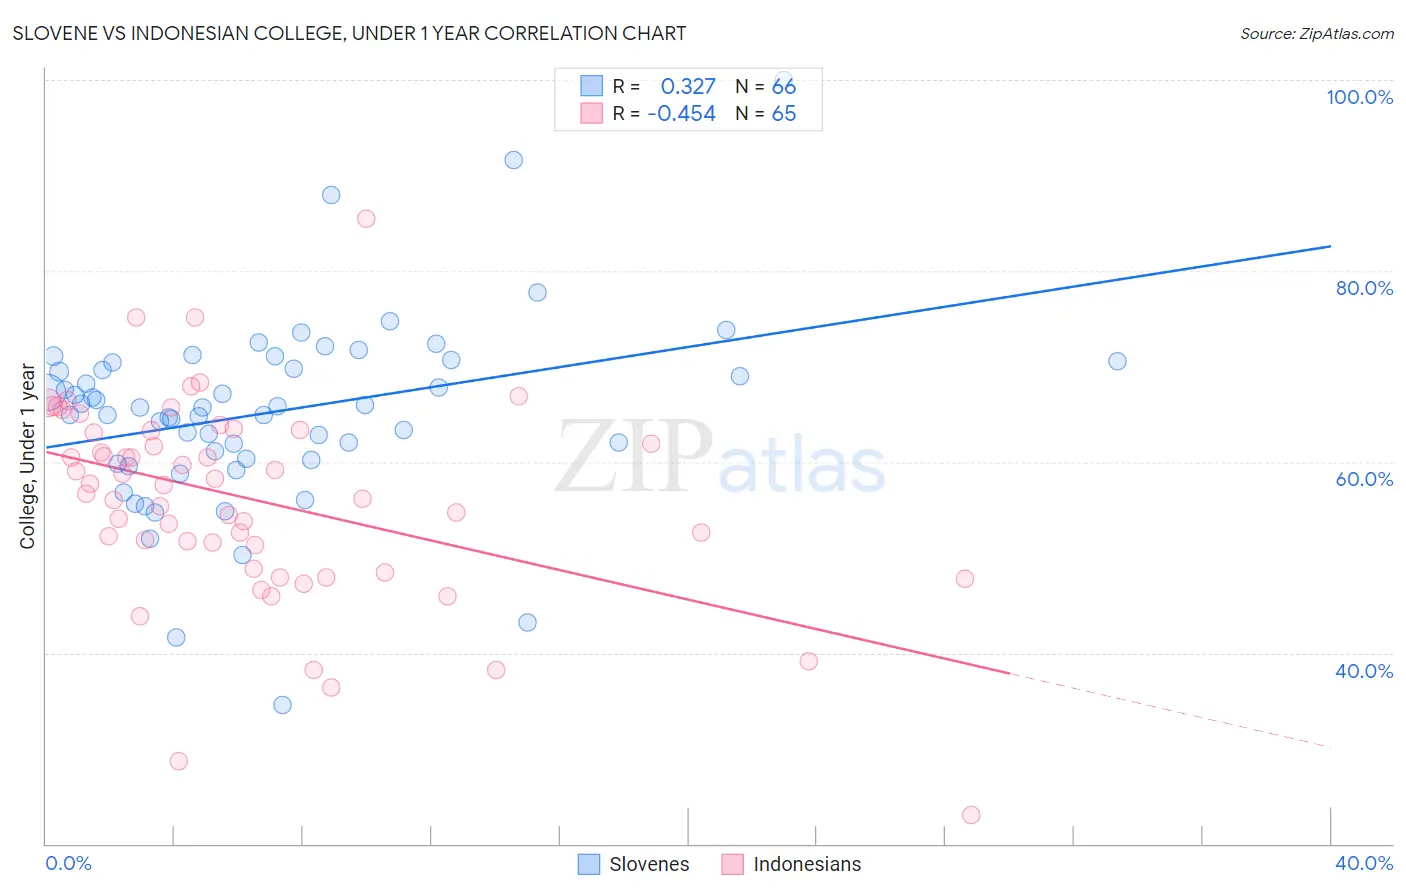
Slovene vs Indonesian College, Under 1 year Correlation Chart
The statistical analysis conducted on geographies consisting of 261,353,399 people shows a mild positive correlation between the proportion of Slovenes and percentage of population with at least college, under 1 year education in the United States with a correlation coefficient (R) of 0.327 and weighted average of 67.3%. Similarly, the statistical analysis conducted on geographies consisting of 162,726,213 people shows a moderate negative correlation between the proportion of Indonesians and percentage of population with at least college, under 1 year education in the United States with a correlation coefficient (R) of -0.454 and weighted average of 61.2%, a difference of 9.9%.
College, Under 1 year Correlation Summary
| Measurement | Slovene | Indonesian |
| Minimum | 34.5% | 23.1% |
| Maximum | 100.0% | 85.5% |
| Range | 65.5% | 62.4% |
| Mean | 65.2% | 56.1% |
| Median | 65.7% | 57.6% |
| Interquartile 25% (IQ1) | 60.3% | 50.0% |
| Interquartile 75% (IQ3) | 70.3% | 63.3% |
| Interquartile Range (IQR) | 10.1% | 13.3% |
| Standard Deviation (Sample) | 10.0% | 10.7% |
| Standard Deviation (Population) | 9.9% | 10.6% |
Similar Demographics by College, Under 1 year
Demographics Similar to Slovenes by College, Under 1 year
In terms of college, under 1 year, the demographic groups most similar to Slovenes are Immigrants from Jordan (67.3%, a difference of 0.090%), Serbian (67.4%, a difference of 0.10%), Immigrants from Northern Africa (67.2%, a difference of 0.11%), Arab (67.2%, a difference of 0.12%), and Lebanese (67.5%, a difference of 0.24%).
| Demographics | Rating | Rank | College, Under 1 year |
| Chileans | 95.3 /100 | #114 | Exceptional 67.6% |
| Basques | 95.2 /100 | #115 | Exceptional 67.6% |
| Immigrants | Nepal | 94.9 /100 | #116 | Exceptional 67.5% |
| Pakistanis | 94.8 /100 | #117 | Exceptional 67.5% |
| Immigrants | Ukraine | 94.7 /100 | #118 | Exceptional 67.5% |
| Lebanese | 94.6 /100 | #119 | Exceptional 67.5% |
| Serbians | 93.9 /100 | #120 | Exceptional 67.4% |
| Slovenes | 93.3 /100 | #121 | Exceptional 67.3% |
| Immigrants | Jordan | 92.8 /100 | #122 | Exceptional 67.3% |
| Immigrants | Northern Africa | 92.7 /100 | #123 | Exceptional 67.2% |
| Arabs | 92.6 /100 | #124 | Exceptional 67.2% |
| Italians | 91.8 /100 | #125 | Exceptional 67.2% |
| Alsatians | 91.3 /100 | #126 | Exceptional 67.1% |
| Czechs | 90.8 /100 | #127 | Exceptional 67.1% |
| Scottish | 90.2 /100 | #128 | Exceptional 67.0% |
Demographics Similar to Indonesians by College, Under 1 year
In terms of college, under 1 year, the demographic groups most similar to Indonesians are Immigrants from Bangladesh (61.3%, a difference of 0.020%), Immigrants from Laos (61.3%, a difference of 0.080%), Blackfeet (61.1%, a difference of 0.17%), Bangladeshi (61.4%, a difference of 0.20%), and African (61.1%, a difference of 0.20%).
| Demographics | Rating | Rank | College, Under 1 year |
| West Indians | 0.4 /100 | #252 | Tragic 61.5% |
| Japanese | 0.4 /100 | #253 | Tragic 61.5% |
| Immigrants | Cambodia | 0.4 /100 | #254 | Tragic 61.5% |
| Comanche | 0.4 /100 | #255 | Tragic 61.4% |
| Bangladeshis | 0.4 /100 | #256 | Tragic 61.4% |
| Immigrants | Laos | 0.3 /100 | #257 | Tragic 61.3% |
| Immigrants | Bangladesh | 0.3 /100 | #258 | Tragic 61.3% |
| Indonesians | 0.3 /100 | #259 | Tragic 61.2% |
| Blackfeet | 0.3 /100 | #260 | Tragic 61.1% |
| Africans | 0.3 /100 | #261 | Tragic 61.1% |
| Barbadians | 0.2 /100 | #262 | Tragic 61.1% |
| Shoshone | 0.2 /100 | #263 | Tragic 61.1% |
| Trinidadians and Tobagonians | 0.2 /100 | #264 | Tragic 61.1% |
| Immigrants | Bahamas | 0.2 /100 | #265 | Tragic 61.1% |
| Alaskan Athabascans | 0.2 /100 | #266 | Tragic 61.0% |